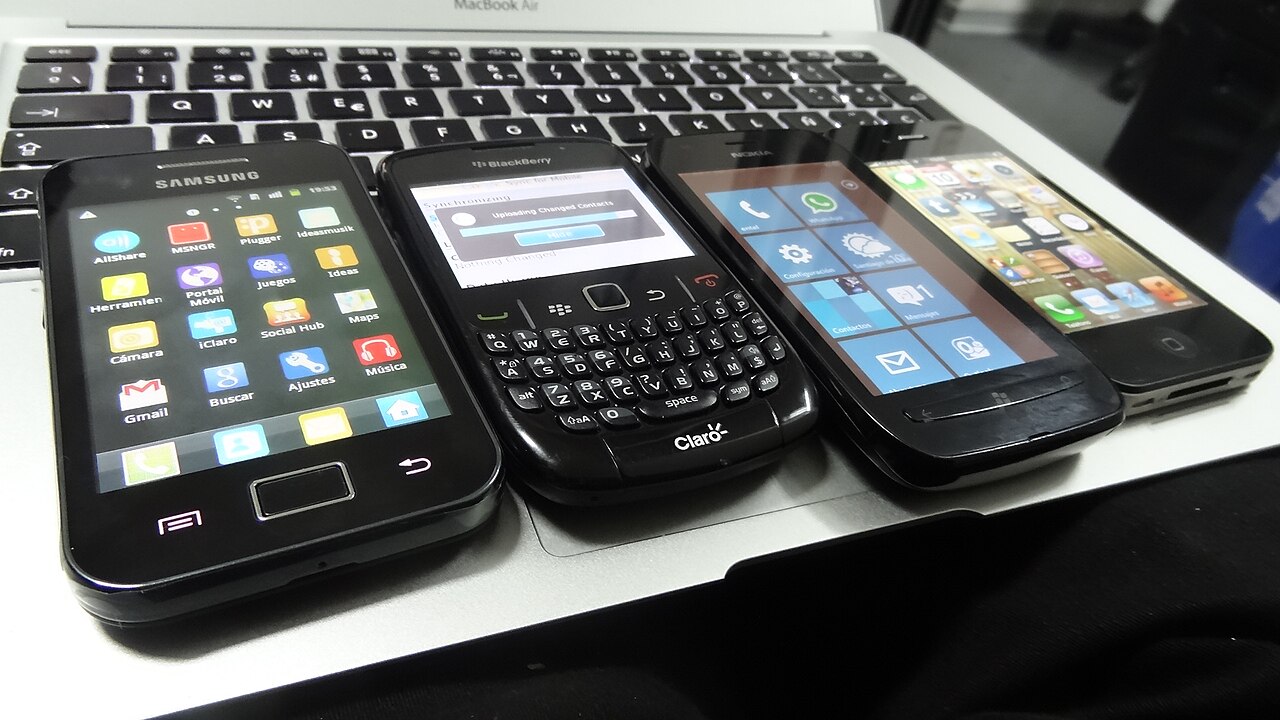
Smartphone Sales Hit Decade Low: Is Apple at Risk?
6/9/2026
Global smartphone sales are heading for their worst year on record in 2026, with shipments set to fall almost 14%. The headline screams trouble for Apple, but the real story for AAPL shareholders is more surprising, and more about margins than phones.
Smartphone Sales Hit a Decade Low: The Numbers
The smartphone market is on track for the ugliest year it has ever recorded. In its 2026 outlook, research firm IDC projects that worldwide smartphone shipments will decline 13.9% year over year to roughly 1.09 billion units, the largest annual contraction in the history of the category. That figure was revised downward from an already-grim February estimate of a 12.9% drop, and it would push global volumes to their lowest level in about a decade.
To put that in perspective, the smartphone industry usually moves in single-digit percentages, up or down, from year to year. A double-digit collapse of nearly 14% is the kind of move you normally only see in a deep recession or a once-in-a-generation supply disruption. This time it is the latter. And that distinction is the single most important thing for investors to understand before they decide whether Apple (AAPL) is genuinely in trouble.
Here is the headline data at a glance:
| Metric (2026 forecast) | Figure | What it means |
|---|---|---|
| Global shipments | ~1.09 billion units | Lowest in roughly a decade |
| Year-over-year change | -13.9% | Steepest drop ever recorded |
| Average selling price (ASP) | +14% to ~$523 | Fewer phones, but pricier ones |
| Android shipments | ~-20% | Budget Android hit hardest |
| Sub-$100 segment | ~171 million units at risk | Becoming "uneconomical" to build |
Notice the contradiction hiding in that table: units are falling off a cliff, yet average selling prices are rising 14% to a record near $523. That is not what a normal demand slump looks like. When consumers simply stop buying, prices fall as manufacturers discount to clear inventory. When prices rise while volumes crash, something is constraining supply and pushing costs up the value chain. That something is memory.
Why Are Smartphone Sales Falling? The AI Memory Crisis
The trigger for the 2026 smartphone collapse is not in your pocket. It is inside the data centers training the world's largest AI models. The hyperscalers - Microsoft (MSFT), Alphabet (GOOGL), Meta (META) and Amazon (AMZN) - are buying high-bandwidth memory (HBM) for AI accelerators as fast as it can be made. That voracious demand has forced the big three memory makers to pivot wafer capacity toward high-margin enterprise components and away from the commodity chips that go into phones.
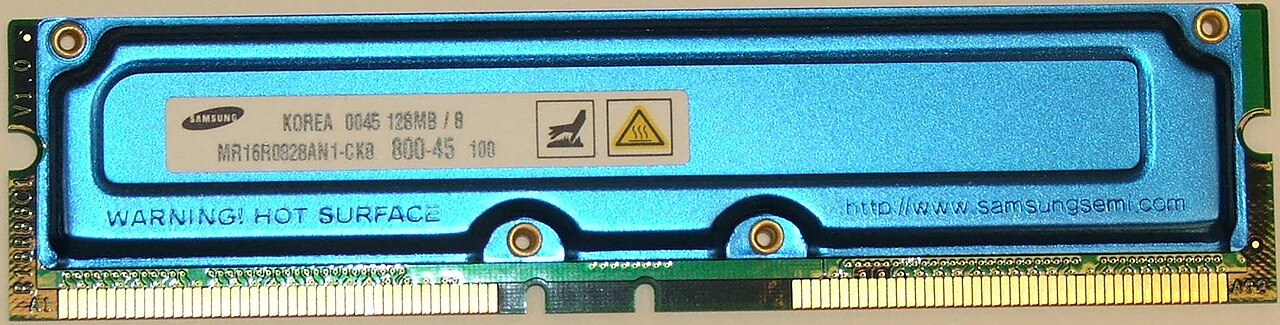
The economics are brutal and simple. Every wafer allocated to an HBM stack for an NVIDIA (NVDA) GPU is a wafer denied to the LPDDR5X module of a mid-range smartphone. With DRAM prices up more than 170% year over year and NAND flash effectively sold out into 2027, phone makers face a stark choice: absorb crushing component costs or raise prices and lose budget-conscious buyers. Most are doing a bit of both, which is exactly why ASPs are climbing as volumes fall.
How memory became the bottleneck
Memory has quietly become the choke point of the entire technology supply chain. We covered the structural roots of this in our deep dive on the 2026 AI memory bottleneck, but the short version is this: AI servers need enormous quantities of DRAM and HBM, those products carry far higher margins than mobile memory, and fabs only have so many wafers. When a fab can sell the same silicon for triple the price to a data center, the phone supply chain loses every time.
A second shock: geopolitics and oil
IDC also flagged the US-Iran conflict and the associated energy shock as a drag on 2026 device demand. Higher oil prices feed into shipping, manufacturing and consumer wallets, and emerging markets, where budget phones dominate, are the most sensitive to that squeeze. The combination of a memory supply crunch and a geopolitical demand hit is what turned an ordinary soft patch into a record decline. For a sense of how these macro forces ripple across sectors, the daily AI-generated market intelligence report tracks the cross-currents in real time.
Is Apple at Risk on Demand? Not Really
Here is where the scary headline and the actual data part ways. If smartphone sales are hitting a decade low, you might assume Apple is bleeding customers. The opposite is happening. Apple has been posting record iPhone revenue even as the broader market shrinks, because the forces crushing the industry hit the cheap end of the market hardest, and Apple does not play there.
In its fiscal first quarter of 2026 (the December holiday quarter), Apple reported quarterly revenue of $143.8 billion, up 16% year over year, with iPhone hitting an all-time revenue record and Services up 14%. The standout was Greater China, where revenue grew 37.9% year over year, primarily driven by iPhone. That is not the profile of a company losing a demand war.
The momentum continued into the March quarter (fiscal Q2 2026):
- iPhone revenue: up 22% to roughly $58 billion, a March-quarter record.
- Services revenue: up 16.3% to a record of about $31 billion.
- Greater China: about $20.5 billion, up 28% from a year earlier.
Why is Apple so insulated on the demand side? Because the memory crisis is a regressive tax on the phone market. It makes the sub-$100 segment, roughly 171 million units, essentially uneconomical to build, and it forces a 20% contraction in Android shipments where budget devices dominate. Apple's average iPhone already sells for many times the price of those vanishing budget phones. When the cheap end of the market disappears, premium brands actually gain share. Apple, Samsung's premium Galaxy line, and other high-end players are mopping up the buyers who remain.
So on the question "is Apple at risk of a demand collapse?" the honest answer based on the 2026 data is no. If anything, a shrinking market that punishes cheap phones plays to Apple's structural strengths. For a refresher on separating a real business problem from a scary headline, our guide on how to analyze a stock before buying walks through exactly this kind of distinction.
The Real Threat to Apple: Margins, Not Units
The genuine risk to Apple is not how many phones it sells. It is what each phone costs to build. The same memory shortage that is shrinking the market is now eating into Apple's gross margin, the single metric that has powered the company's earnings machine for years.

On recent earnings calls, CEO Tim Cook acknowledged "significantly higher memory costs" driven by global AI chip demand competing with TSMC's leading-edge supply, and warned that "memory costs will drive an increasing impact on our business." Management quantified part of the hit: Apple expects roughly a 140 basis point drag on gross margin in 2026 from rising DRAM prices alone.
You can see the squeeze forming in the guidance. Apple's gross margin expanded to an all-time record of 49.3% in fiscal Q2 2026. Yet for fiscal Q3, management guided gross margin to a range of 47.5% to 48.5%, even while projecting healthy revenue growth of 15% to 17%. In other words, Apple is still growing the top line, but the cost of memory is starting to chip away at profitability per dollar of sales.
| Period (FY2026) | Gross margin | Note |
|---|---|---|
| Q1 (Dec quarter) | ~47-48% range | Record revenue of $143.8B |
| Q2 (Mar quarter) | 49.3% (all-time record) | iPhone +22%, China +28% |
| Q3 guidance | 47.5% - 48.5% | Memory costs begin to bite |
| 2026 DRAM headwind | ~-140 bps | Per management commentary |
A 140 basis point margin hit may not sound dramatic, but on a company that generates hundreds of billions in revenue, every basis point is worth real money, and the market prices Apple as a business whose margins only go up. The key uncertainty is timing: industry analysts expect memory prices to stabilize around mid-2027, but not to return to prior levels. That means the margin pressure is unlikely to be a one-quarter event. Investors should watch the gross-margin guidance line on each earnings call far more closely than the iPhone unit headline.
Apple's Valuation: Priced for Perfection?
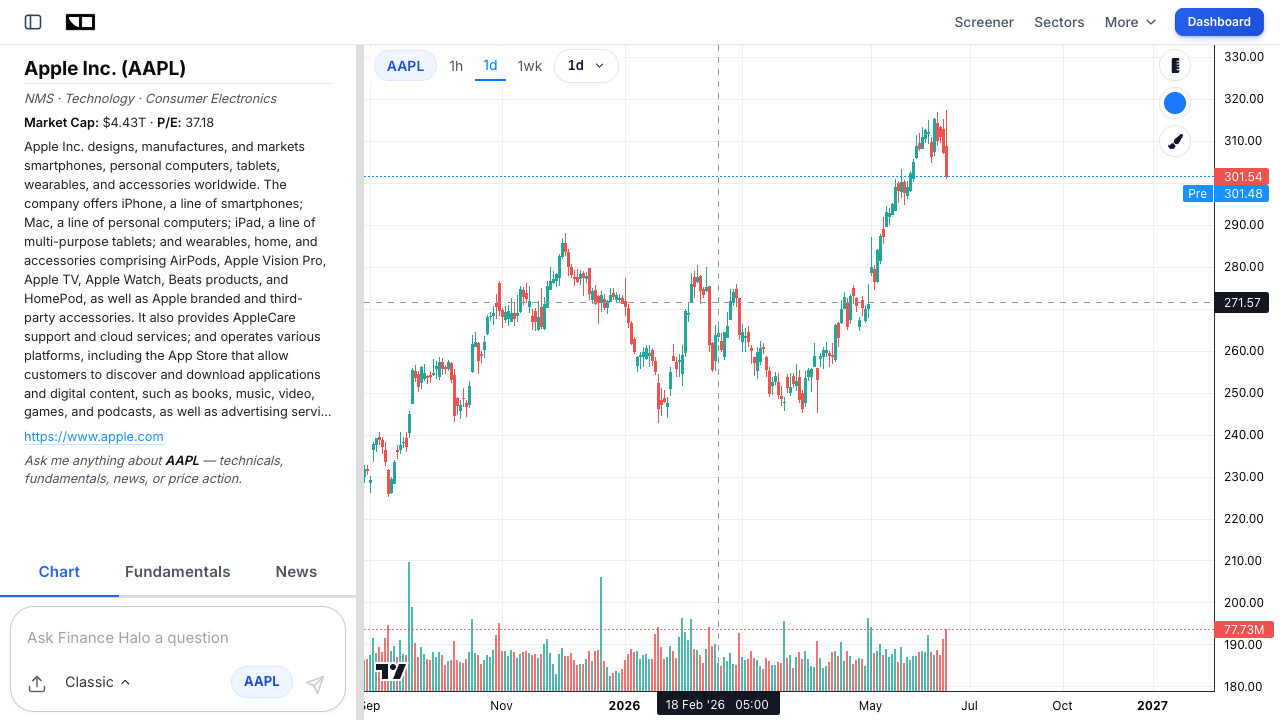
Margins matter even more when a stock is priced for flawless execution, and Apple is. As of early June 2026, AAPL carried a market capitalization of about $4.66 trillion and traded at a trailing price-to-earnings (P/E) ratio of roughly 37, against a 10-year median closer to 26.5. That is about 40% above its own historical norm.
Here is the valuation snapshot:
| Valuation metric | Value (June 2026) |
|---|---|
| Market capitalization | ~$4.66 trillion |
| Trailing P/E (TTM) | ~37.2 |
| Forward P/E | ~33.7 |
| 10-year median P/E | ~26.5 |
| Premium to median | ~40% |
Why does this matter for the smartphone story? Because a premium multiple is a bet that future earnings will be higher and steadier than average. A margin headwind that lasts into 2027 is precisely the kind of thing that can compress both earnings and the multiple investors are willing to pay for them. When a richly valued stock disappoints even slightly on margins, the de-rating can be sharp.
The gap between the trailing P/E of 37 and the forward P/E of about 34 also tells you the market still expects earnings to grow. If you are new to reading these numbers, start with our explainer on what counts as a good P/E ratio, and then see why the distinction between trailing and forward multiples matters in our breakdown of forward P/E versus trailing P/E. For a company facing a known margin squeeze, the forward number deserves extra scrutiny, because it depends on estimates that may still be too optimistic.
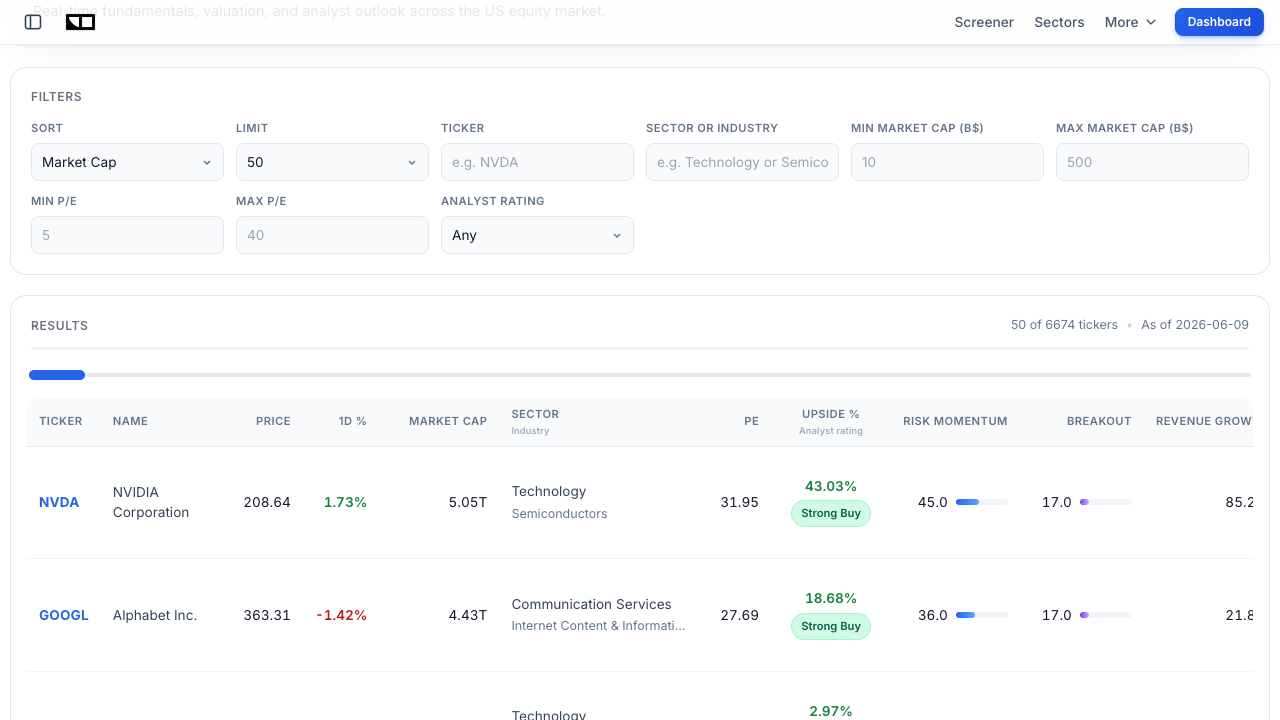
You can pull Apple's live valuation metrics alongside its peers using the Finance Halo market screener, which lets you filter by P/E range, sector and market cap to see how AAPL stacks up against the rest of mega-cap tech.
Winners and Losers of the Smartphone Shakeout
A market that shrinks 14% while prices rise 14% does not hurt everyone equally. The memory crisis is reshuffling the deck, creating clear relative winners and losers across the supply chain. Understanding who sits where is the key to turning a scary headline into an actual investment thesis.
| Player | Position | Why |
|---|---|---|
| Apple | Relative winner (volume), pressured (margin) | Premium pricing power, China strength, share gains, but rising memory costs |
| Samsung premium line | Winner | Secured memory supply, stronger flagship, gaining mid-range share |
| Budget Android makers | Loser | Sub-$100 segment becoming uneconomical; ~20% Android volume drop |
| Memory makers (e.g. Micron) | Winner | Pricing power as DRAM and NAND demand outstrips supply |
| AI chip leaders (NVIDIA, Broadcom) | Winner (root cause) | HBM demand is what diverted memory from phones |
The most counterintuitive winner is the memory industry itself. The same shortage hammering phone makers is a windfall for suppliers like Micron (MU), whose DRAM and NAND command premium pricing. In a sense, the smartphone slump is a transfer of profit from device makers to chip makers. The AI infrastructure boom that created this dynamic is the through-line connecting it all, a theme we explored in our look at whether the AI trade is cracking after June's chip selloff, and in our profile of Marvell as a potential trillion-dollar AI stock.
For Apple specifically, the takeaway is nuanced: it is a winner on the demand side of the smartphone war and a victim on the cost side of the memory war. Those two forces partly offset, which is why the stock has held up far better than the "decade-low sales" headline would imply.
Real-World Example: Reading Apple's Q3 FY2026 Guidance
Let's walk through how a careful investor would actually read Apple's most recent guidance, because this is where the real signal lives. Imagine you only saw the headline "global smartphone sales to hit decade low" and panicked out of AAPL. Now look at what the company actually told investors for fiscal Q3 2026:
- Revenue growth guidance: 15% to 17% year over year. That is acceleration, not contraction, in a market said to be collapsing.
- Gross margin guidance: 47.5% to 48.5%, down from a record 49.3% the prior quarter. This is the tell.
- Management commentary: explicit warnings about "significantly higher memory costs" with "an increasing impact" ahead.
The story those three data points tell together is clear: demand is fine, even strong, but profitability per dollar of revenue is starting to erode. A disciplined investor would model the earnings impact. If revenue grows mid-teens while gross margin slips roughly 100 to 150 basis points, earnings still grow, but more slowly than the top line, and slower earnings growth is hard to justify at a 37x multiple.
Contrast that with the naive reading. The headline-driven investor sells on "decade low," misses that Apple is gaining share, and overlooks the actual risk sitting in plain sight in the margin line. The data-driven investor ignores the scary headline, zeroes in on the gross-margin guide, and reaches a far more useful conclusion: the question is not whether Apple can sell phones, but whether its premium valuation can survive a multi-quarter margin squeeze. You can stress-test that thesis yourself by pulling up an instant AI analysis of Apple and asking the assistant to walk through the margin trajectory.
How to Analyze the Apple Risk Yourself
You do not need a Wall Street terminal to evaluate whether Apple is at risk. Here is a repeatable, five-step framework you can run today.
- Separate the supply story from the demand story. Ask whether falling industry volumes reflect lost demand or constrained supply. In 2026, rising ASPs prove it is supply. That immediately tells you premium players are insulated.
- Find the company's real exposure. For Apple, the exposure is component costs, not unit demand. Pull the last two earnings calls and read the gross-margin guidance and management's cost commentary, not just the revenue headline.
- Quantify the margin hit. A 140 basis point gross-margin headwind on a company of Apple's scale is material. Translate it into an earnings impact and compare that to consensus estimates.
- Check the valuation cushion. Use the market screener to see Apple's P/E versus its history and peers. A 40% premium to the 10-year median means little room for error.
- Define your catalysts and invalidation. The bullish catalyst is memory price stabilization (expected around mid-2027) and continued share gains. The bear case confirms if margins keep sliding and the multiple compresses. Write down what would change your mind.
For the valuation step, it helps to combine multiple metrics rather than leaning on P/E alone. Our comparison of what makes a good price-to-sales ratio shows how to triangulate value across different lenses, which matters for a company where margins, not sales, are the swing factor. And if you want the macro backdrop, the market intelligence dashboard frames where memory, AI capex and consumer demand sit in the current cycle.
Common Mistakes to Avoid
- Confusing a supply shock with a demand collapse. A 14% volume drop sounds like consumers fleeing, but rising prices prove it is a supply constraint. Fix: always check whether ASPs are rising or falling before you interpret a volume number.
- Reading the iPhone unit headline instead of the margin line. Apple's risk in 2026 is profitability, not sales. Fix: prioritize the gross-margin guidance on every earnings call.
- Assuming a shrinking market hurts the market leader most. When the cheap end disappears, premium brands gain share. Fix: map which price tier is actually contracting.
- Ignoring valuation because "it's Apple." A great company at 40% above its historical multiple is still a valuation risk. Fix: anchor every thesis to the price you are paying, not just the brand.
- Treating the memory squeeze as temporary. Prices may stabilize in mid-2027 but are not expected to fully normalize. Fix: model a multi-quarter, not a one-quarter, headwind.
- Forgetting the second-order winners. The crisis hurting phone makers is a windfall for memory suppliers. Fix: look across the whole supply chain, not just the obvious name.
Frequently Asked Questions
Why are smartphone sales falling to a decade low in 2026?
The primary driver is an AI-fueled memory shortage. Hyperscalers buying high-bandwidth memory for AI servers have pushed DRAM prices up over 170% and pulled wafer capacity away from mobile chips. That raises phone costs, prices out budget buyers, and shrinks unit volumes. A geopolitical energy shock from the US-Iran conflict added further pressure on price-sensitive emerging markets.
Is Apple stock actually at risk from the smartphone slump?
Not in the way the headline suggests. Apple is gaining share as the budget market collapses, and it posted record iPhone revenue with Greater China up nearly 38%. The genuine risk is to gross margins, which Apple guided down from a record 49.3% toward 47.5-48.5% as memory costs rise. The threat is profitability and a stretched valuation, not unit demand.
How much will memory costs hurt Apple's margins?
Apple's management pointed to roughly a 140 basis point gross-margin headwind in 2026 from rising DRAM prices, and CEO Tim Cook warned that memory costs will have "an increasing impact" on the business. Because memory prices are not expected to fully normalize until after mid-2027, investors should treat this as a multi-quarter pressure rather than a one-off.
Which companies benefit from the smartphone memory crisis?
Memory suppliers such as Micron are clear winners, gaining pricing power as DRAM and NAND demand outstrips supply. AI chip leaders like NVIDIA and Broadcom are the root-cause beneficiaries, since their HBM demand diverted memory from phones. Among device makers, premium brands like Apple and Samsung's flagship line gain share as cheap Android phones disappear.
Is Apple stock overvalued in 2026?
By its own history, AAPL looks expensive. It trades around 37 times trailing earnings versus a 10-year median near 26.5, roughly a 40% premium, with a market cap of about $4.66 trillion. Whether that is "overvalued" depends on whether Apple can keep growing earnings through the margin squeeze, which is exactly why the gross-margin trajectory is the metric to watch.
Will smartphone sales recover after 2026?
A recovery depends largely on memory prices. Analysts expect DRAM and NAND prices to stabilize around mid-2027, which should ease the cost pressure that is currently shrinking the market, though prices are not expected to return to prior lows. Pent-up replacement demand could then support a rebound, but the budget segment may be permanently smaller.
Should I buy, hold, or sell Apple based on this news?
This article is educational, not advice, so the right answer depends on your own risk tolerance and time horizon. The framework matters more than the verdict: weigh Apple's demand-side strength and share gains against a real margin headwind and a premium valuation. Run the numbers yourself, define what would change your mind, and use tools like the screener and AI assistant to pressure-test the thesis before acting.
Conclusion
The "smartphone sales hit a decade low" headline is true, dramatic, and largely misunderstood. Global shipments really are set to fall 13.9% in 2026, the worst on record, but the cause is an AI-driven memory supply shock, not a collapse in consumer appetite. That distinction flips the conclusion for Apple. On the demand side, a shrinking market that wipes out budget phones actually plays to Apple's premium strengths, which is why iPhone revenue keeps setting records and Greater China is booming.
The real risk sits one line down in the financials. Rising memory costs are squeezing Apple's gross margin from a record 49.3% toward a guided 47.5-48.5%, a roughly 140 basis point headwind that could persist into 2027. Stack that on a 37x P/E and a $4.66 trillion market cap, and you have a stock priced for perfection just as a known cost pressure builds. So is Apple at risk? Yes, but from margins and valuation, not from a smartphone demand collapse. The investors who understand that difference are reading the gross-margin guide while everyone else panics over the headline.
Try it yourself: Analyze AAPL with Finance Halo's AI assistant to get instant price targets, margin trends, and valuation insights in seconds.
Disclaimer: This article is for educational purposes only and does not constitute investment advice. Always do your own research before making investment decisions.