What Is a Good P/E Ratio? (By Industry, With Examples)
10/11/2025
The P/E ratio is one of the most popular stock valuation metrics, but what counts as a "good" P/E ratio depends on the industry, market conditions, and the company's growth outlook. This guide breaks it all down with real examples.
Understanding the Price-to-Earnings (P/E) Ratio
The P/E ratio (price-to-earnings ratio) tells you how much investors are paying for each dollar of a company's earnings. In formula form:
For example, if a company's stock trades at $120 per share and its EPS is $5, then its P/E ratio is 24, meaning the stock is priced at 24 times its earnings. In plain language, a P/E of 24 indicates investors are willing to pay $24 for every $1 of the company's earnings.
A high P/E ratio means the stock price is high relative to earnings. This could signal that investors expect higher growth in the future, or it could mean the stock might be overvalued at the moment. Conversely, a low P/E ratio means the stock price is low compared to earnings. That can indicate a potentially undervalued stock or a company that is very profitable relative to its price.
However, context is critical. A low P/E is not automatically "good" and a high P/E is not automatically "bad" without further analysis. The P/E ratio is just one piece of the puzzle when you analyze a stock before buying.
How the P/E Ratio Is Calculated (Simple Example)
Calculating the P/E ratio is straightforward. Here are the steps:
- Find the Earnings Per Share (EPS): This is the company's net profit divided by the number of outstanding shares. For instance, if a company earned $10 billion over the last year and has 2 billion shares outstanding, its EPS would be $5 per share (i.e. $10 billion / 2 billion shares).
- Divide the Share Price by EPS: If that company's current stock price is $120, then P/E = $120 / $5 = 24. This tells us the stock is trading at 24 times its earnings.
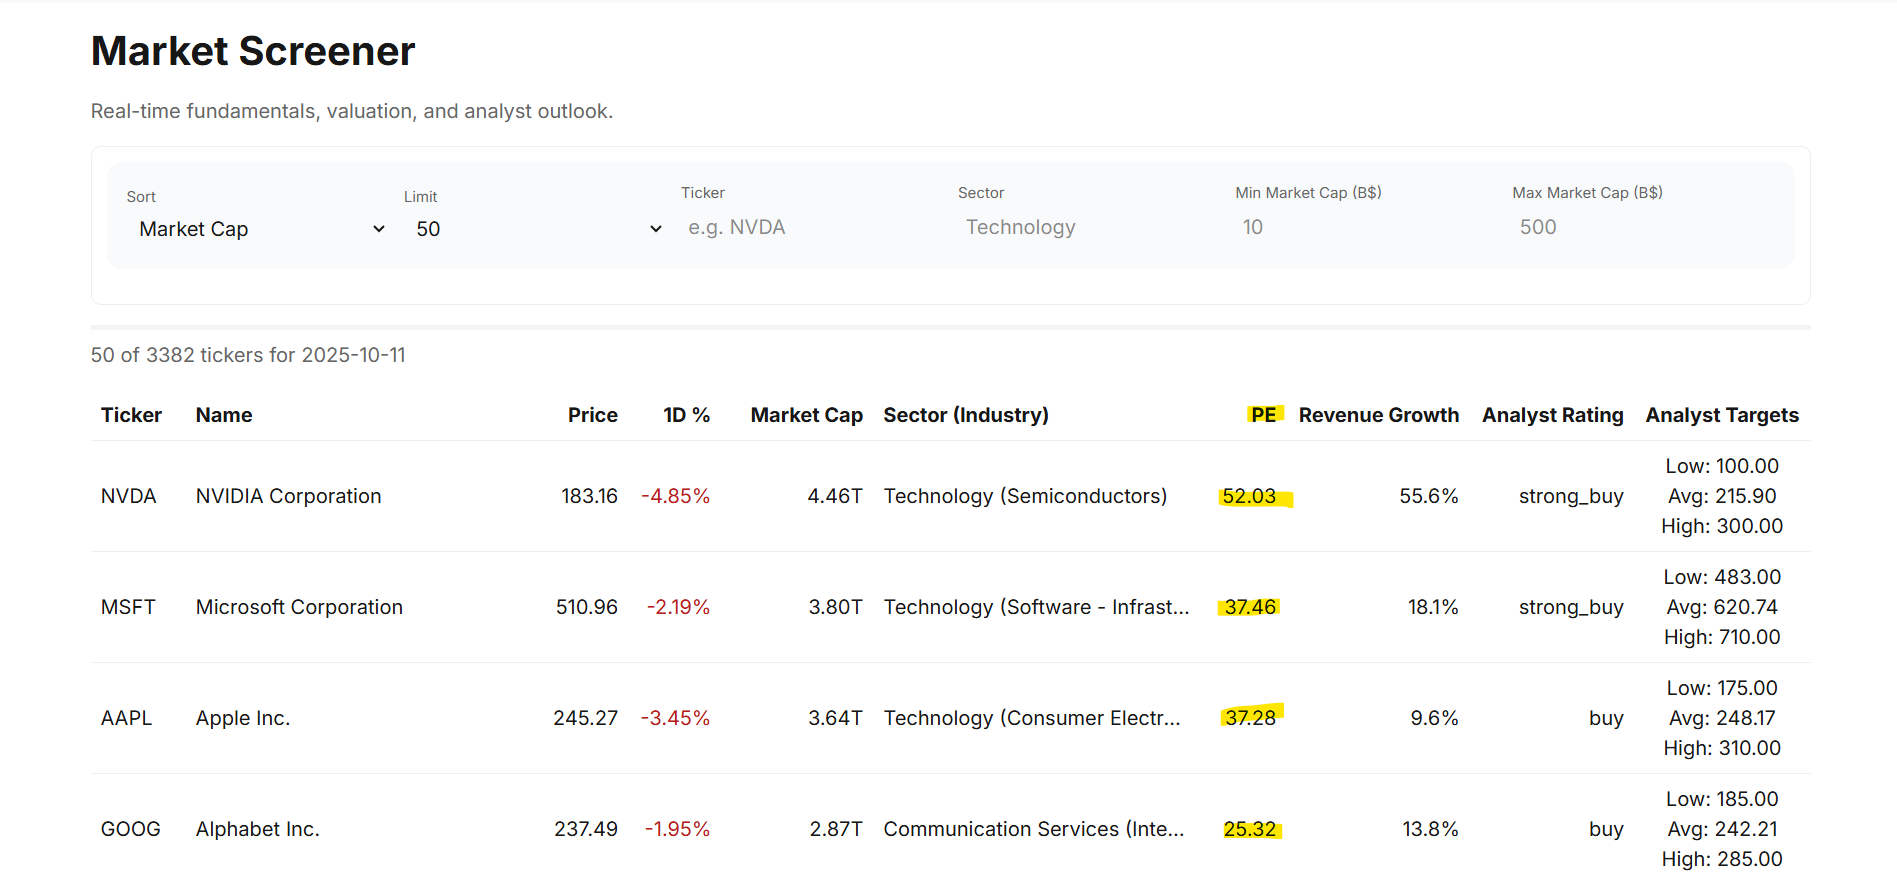
You can usually find both price and EPS readily. Stock prices are listed on any exchange, and EPS can be found in a company's financial statements or on finance websites. You can also use the Finance Halo market screener to quickly compare P/E ratios across hundreds of stocks with real-time data.
Note that P/E can be calculated using trailing earnings (past 12 months of actual earnings) or forward earnings (projected earnings for the next year). Trailing P/E is based on actual reported earnings, while forward P/E uses analysts' earnings forecasts. Beginners should be aware of which one is being quoted, but in either case, the P/E represents a price-to-earnings multiple.
What Is Considered a "Good" P/E Ratio?
When is a P/E ratio "good"? The truth is, there is no single magic number. A "good" P/E ratio depends on context: the company's industry, the overall market, and the company's growth prospects all matter. That said, we can discuss some general benchmarks and guidelines.
Historical Market Averages
Historically, the overall U.S. stock market (for example, the S&P 500 index) has traded at a P/E ratio of around 15-16 on average over the long term. This is often considered a baseline for a "normal" market valuation. If a stock's P/E is near that long-term market average, you might consider it fairly valued relative to history.
Recent Norms
In more recent years, P/E ratios have trended higher than the 20th-century historical average. Many investors consider a P/E in the range of roughly 20 to 25 to be a typical average in modern market conditions. Financial analysts often cite that any P/E ratio below about 20-25 could be considered "good" or at least acceptable in terms of not being overpriced.
It is important to note that market-wide P/E ratios fluctuate over time. During bull markets, overall P/Es often rise; during recessions, earnings can fall and make P/Es look very high even if stock prices drop. For instance, in the last 20 years the P/E of the S&P 500 has swung from as low as about 13 to over 100 at extreme points. The extremely high P/E occurred in early 2009 when earnings plunged during the recession, driving the ratio up despite lower stock prices.
Comparing P/E to Peers and Industry
One of the best ways to judge if a P/E is good is to compare it to other similar companies. A P/E that is low relative to a company's competitors or industry average can signal a bargain (or perhaps a company in trouble), while a P/E much higher than peers can signal high growth expectations or an overvalued stock. You can use the sector performance dashboard to quickly identify which sectors are currently trading at higher or lower multiples, then drill into specific competitors.
For example, a P/E of 18 might be good for a tech stock if its peers average 25, but a P/E of 18 could be high for a utility stock if its peers average 12. As a rule of thumb, many value-oriented investors like to see P/E ratios in the teens or lower. Benjamin Graham (Warren Buffett's mentor) often looked for stocks with P/E around 15 or less as potentially undervalued. Today, a P/E under 20 is often considered reasonable, and the sweet spot for many investors might be something like 15-20 for a stable company.
P/E Ratios by Industry: Why They Vary
P/E ratios can vary drastically by industry. What counts as a "good" P/E in one sector could be completely different in another. This is because industries have different typical growth rates, risk profiles, and business models. Here is a look at how P/Es differ across sectors:
| Sector | Typical P/E Range | Why |
|---|---|---|
| Technology / Growth | 25-40+ | High growth expectations justify premium multiples |
| Consumer Staples | 18-25 | Stable demand and steady but slow growth |
| Energy (Oil & Gas) | 5-15 | Cyclical earnings tied to commodity prices |
| Financial Services (Banks) | 8-14 | Modest growth, tied to interest rates and economic cycles |
| Utilities | 10-20 | Regulated, stable but slow-growing earnings |
| Real Estate (REITs) | 15-30+ (varies widely) | Accounting nuances; specialty REITs like data centers can be 90+ |
High-Tech and Growth Industries
These tend to have higher P/E ratios on average. Investors in tech, biotech, or internet sectors are often willing to pay a premium for future growth. The technology sector in the U.S. has an average P/E around the mid-20s, and many software or internet companies often trade at 30+ times earnings. High-growth tech giants can have even higher multiples. It is not unusual to see popular tech stocks with P/E ratios well above 30 or 40 when growth expectations are strong.
Energy (Oil & Gas)
Traditional energy companies often have lower P/E ratios. These businesses are cyclical and subject to commodity price swings, so investors tend to pay less for each dollar of earnings. The oil and gas industry in a recent period had an average P/E of around 6, extremely low compared to the market. A P/E in the single digits is common for oil producers, especially when their earnings are at a cyclical high. An oil company might look "cheap" with a P/E of 8, but in that industry, single-digit P/Es are normal and not necessarily a sign of a bargain. It could even signal peak earnings.
Financial Services (Banks)
Banks and insurance companies also typically sport low P/E ratios, often in the low teens or single digits. Their growth is modest and tied to interest rates and economic cycles. In early 2025, the diversified banking industry in the U.S. had an average P/E under 8. A bank stock with a P/E of 8 or 9 might be considered attractive relative to history, whereas a tech stock with that P/E would be extraordinarily low.
Consumer Staples and Retail
Consumer staples companies (like food, beverage, household product makers) often have moderate P/Es, typically somewhere in the high teens to 20s. These are stable, slow-growing businesses but with steady demand. Coca-Cola, a classic consumer staples stock, has a P/E around 23-24 in 2025, which is in line with the broader market. Retail companies can range widely: a high-growth e-commerce retailer might have a high P/E, while a slow-growth brick-and-mortar retailer might have a low P/E.
Utilities
Utility companies generally have lower P/E ratios. They are regulated, with stable but slow-growing earnings, so historically their P/Es are often in the low-teens or even single digits. Many utility stocks trade with P/E ratios around 10 to 20 depending on the interest rate environment. When interest rates are low, investors pay more for utilities' steady dividends, which can raise their P/Es; when rates are high, utilities' P/Es tend to compress.
Real Estate (REITs)
Real Estate Investment Trusts have varied P/Es and sometimes use a different metric (funds from operations, or FFO, instead of earnings). Property REITs might trade in the teens or 20s P/E, whereas certain specialty REITs (like data center REITs) can have very high P/E ratios. The data center REIT industry had an average P/E near 95 in early 2025, due to strong growth prospects and accounting nuances.
These examples demonstrate why you must compare a stock's P/E to its industry peers. Analysts often say "compare apples to apples" when evaluating P/E: compare a tech stock's P/E to other tech stocks, a bank to other banks, etc. The stock scores screener on Finance Halo lets you quickly rank stocks within sectors using quantitative deep value and momentum scores, which factors in P/E alongside other key metrics.
Growth Stocks vs. Value Stocks: P/E Differences
Investors often categorize stocks as "growth" or "value" based in part on their P/E ratios. Understanding this distinction is essential for interpreting what a P/E number really means.
Growth Stocks
These are companies expected to grow earnings at an above-average rate. Growth stocks usually have high P/E ratios. Investors are willing to pay more per dollar of current earnings because they expect those earnings to increase rapidly in the future.
For example, consider Tesla. In 2025, Tesla's P/E ratio was well into the triple digits (over 200) based on trailing earnings, a reflection that investors anticipate far higher future earnings and are pricing the stock accordingly. Even at earlier points, Tesla traded around 40-50 times earnings while traditional automakers were around 10x, illustrating how growth expectations justify a much higher multiple.
Sometimes growth companies have no profits yet (earnings are zero or negative), so they effectively have no P/E or a meaningless P/E (often shown as N/A). Investors in these cases focus on future earnings potential. It is common to see P/E ratios above 30, or no P/E at all, in high-growth sectors. This is not "bad" per se, but it means investors have high expectations. If those expectations falter, high-P/E stocks can see sharp price drops.
Value Stocks
These are companies considered undervalued or out-of-favor, often with lower P/E ratios. Value stocks typically are mature businesses with steady or slow growth, or companies that have fallen out of favor due to some challenges but still have solid fundamentals. If you are interested in this approach, our beginner's guide to deep value stocks covers the key strategies and metrics to identify undervalued companies.
Investors look at low P/E ratios (relative to the market or industry) as a sign that a stock might be a bargain. As a rough guideline, stocks with P/Es in the single digits are often labeled value stocks. Many financial and energy stocks in recent times have had P/Es below 10, fitting the value profile. A company like Exxon Mobil, with a P/E around 15-16 in 2025, could be seen as value-leaning compared to the overall market (since 15 is below the market's ~20+ average).
It is important to understand that "low P/E" does not always mean "good investment." Sometimes a stock has a low P/E for a reason. A company with declining earnings or facing big risks might have a cheap valuation because investors are not optimistic about its future. Conversely, a very high P/E stock is not guaranteed to succeed, as the growth might not pan out.
Many investors blend these concepts, seeking a "Growth at a Reasonable Price" (GARP) approach: they buy growth companies but only if the P/E is not exorbitantly high relative to the growth rate. That introduces the idea of the PEG ratio (price/earnings to growth), which adjusts the P/E for expected growth. You can learn more about this metric in our guide on what makes a good PEG ratio.
How Does the P/E Ratio Compare to EPS and PEG?
The P/E ratio is powerful, but it works best when combined with other valuation metrics. Two closely related metrics are EPS (Earnings Per Share) and the PEG ratio (Price/Earnings to Growth).
EPS is the raw earnings figure that feeds into the P/E calculation. A rising EPS is generally positive, but EPS alone does not tell you whether a stock is cheap or expensive. That is where the P/E ratio comes in, by comparing price to those earnings.
The PEG ratio takes the analysis a step further by dividing the P/E ratio by the company's expected earnings growth rate. A PEG below 1.0 often suggests the stock is undervalued relative to its growth, while a PEG above 2.0 may signal overpricing. This makes PEG especially useful for evaluating growth stocks where a high P/E might actually be justified by rapid earnings expansion.
For a detailed breakdown of how these three metrics work together, including formulas, pros and cons, and real-world examples, read our complete guide to P/E ratio vs EPS vs PEG.
Examples: P/E Ratios of Major Companies
Let's look at some real-world examples of well-known U.S. companies and their P/E ratios (as of late 2025). This will illustrate how varied P/E ratios can be and help put the above concepts into perspective:
| Company (Sector) | P/E Ratio (TTM) | Context |
|---|---|---|
| Apple (AAPL) - Tech Hardware | ~37 | Apple is a mega-cap tech company with steady growth. Its P/E in the high-30s suggests investors still see good growth prospects ahead, and it trades at a premium to the market average. This is a fairly typical P/E for a successful technology stock. |
| Tesla (TSLA) - Automaker/Tech | ~221 | Tesla's triple-digit P/E reflects it as a high-growth stock. Investors are paying over 200 times current earnings, indicating they expect massive future earnings growth. Such a P/E is extraordinarily high and justified only by strong belief in Tesla's expansion. |
| Coca-Cola (KO) - Consumer Staples | ~24 | Coca-Cola's P/E in the low-to-mid 20s is close to the market average. As a stable consumer staples giant, this moderate P/E suggests the stock is fairly valued, reflecting steady (but not high) growth and reliable profits. |
| Exxon Mobil (XOM) - Energy (Oil & Gas) | ~16 | Exxon's P/E in the mid-teens is relatively low compared to the overall market, fitting its profile as a value/cyclical stock. In the oil industry context, mid-teens is actually on the higher side since many oil peers are in the single digits. |
TTM = Trailing Twelve Months (based on past 12 months earnings). As you can see, different companies and sectors show very different P/E ratios at the same point in time. Tesla's extremely high P/E embodies a growth stock with lofty expectations, while Exxon's lower P/E shows a value-tilted stock in a mature industry. Apple and Coca-Cola sit somewhere in between.
Want to see how these companies look right now? You can instantly analyze Apple's latest valuation with Finance Halo's AI assistant, or ask about Tesla's current P/E and growth outlook.
How to Use the P/E Ratio When Analyzing a Stock
Here is a practical step-by-step framework for using the P/E ratio as part of your stock analysis process:
- Look up the stock's current P/E ratio. You can do this on the Finance Halo market screener, which displays trailing and forward P/E for hundreds of stocks.
- Compare it to the market average. If the stock's P/E is significantly above or below the S&P 500 average (~20-25 in recent years), ask why.
- Compare it to industry peers. Use the sector performance dashboard to see which sectors are trading at higher or lower multiples, then drill into specific competitors.
- Check the growth rate. A high P/E may be justified if earnings are growing rapidly. Calculate the PEG ratio to see if the price makes sense relative to growth.
- Look at the trend. Is the P/E expanding (stock getting more expensive) or compressing (getting cheaper)? Consider whether earnings are rising, falling, or temporarily depressed.
- Combine with other metrics. P/E alone is never enough. Look at price-to-book (P/B), price-to-sales (P/S), dividend yield, debt levels, and the company's competitive position. Our guide on how to analyze a stock before buying walks you through this full process.
Key Takeaways on Using the P/E Ratio
- The P/E ratio is a simple but powerful metric for stock valuation. It tells you how many dollars you are paying for each dollar of earnings. Use it as a starting point to gauge valuation.
- A "good" P/E ratio is relative. There is no fixed number that is universally good. Compare a stock's P/E with the market average, its industry peers, and its own historical P/E range to judge its valuation.
- Historical benchmarks: The U.S. market's long-term average P/E is around 15-16, but in recent years 20+ is common. A P/E lower than the prevailing market average can be considered attractive, if other factors are positive.
- Industry matters: Know the typical P/E range for the sector. Tech and growth industries have higher P/E ratios, while sectors like utilities, energy, and finance have lower P/Es. Always compare like with like.
- Growth vs. value: High P/E stocks (growth stocks) can be good investments if the company delivers growth, but they carry more risk if expectations are not met. Low P/E stocks (value stocks) might be undervalued opportunities or could be cheap for a reason.
- Do not use P/E in isolation. It is a quick check, not the final word. Combine it with EPS, the PEG ratio, P/B, P/S, dividend yield, and fundamentals for a complete picture. Check the P/E vs EPS vs PEG comparison guide to learn how these metrics complement each other.
- Check daily opportunities: The Finance Halo daily highlights surface ranked risk/reward opportunities, including stocks with attractive valuation metrics.
Conclusion
The P/E ratio is a useful tool for beginners and experienced investors alike to assess stock valuation. A "good" P/E ratio generally means you are not overpaying for a stock's earnings relative to some benchmark. For a beginner, a practical approach is: look for companies with P/E ratios not too far above the market or industry average, unless you have strong reason to believe their growth will outperform.
If you find a stock with a much lower P/E than its peers, investigate why. It could be an undervalued gem or a value trap. By understanding the P/E ratio in context, you can make more informed decisions and blend this insight with other analysis to build a solid investment strategy. Happy investing!
Try it yourself: Use Finance Halo's AI assistant to get instant P/E analysis on any stock. Just type a ticker and ask your question, or start with the market screener to filter stocks by P/E, sector, market cap, and more.
Disclaimer: This article is for educational purposes only and does not constitute investment advice. Always do your own research before making investment decisions.