How to Analyze a Stock Before Buying: Beginner Guide
9/5/2025
How to Analyze a Stock Before Buying: Beginner Guide
If you're new to the U.S. stock market, diving into stock analysis might sound intimidating. However, stock analysis for beginners is not rocket science – if you can read a nutrition label or a recipe, you can learn the basics of evaluating a stock .
This beginner’s guide will walk you through stock investing basics in a friendly, easy-to-understand way, using plain language and simple examples. By the end, you'll know how to evaluate a stock step by step, from checking financial health to considering market trends and management quality. Think of it like doing a background check on a company before you buy a piece of it – a bit of homework now can help you invest with confidence.
Why Analyze a Stock Before You Buy?
Buying a stock means buying a small ownership stake in a company. Just as you wouldn’t buy a car without looking under the hood, you shouldn’t buy a stock without understanding the business. Analyzing a stock before buying helps you:
- Make Informed Decisions: Successful investors don’t just guess when picking stocks; they examine the company’s data to decide if it’s a good investment . Researching fundamentals can prevent impulsive buys based on hype.
- Understand What You Own: When you analyze a stock, you learn what the company does, how it makes money, and the risks it faces. This knowledge lets you invest in companies you truly believe in (Peter Lynch famously advised, "invest in what you know", meaning companies whose business you understand).
- Avoid Overpaying: Analysis helps you determine if a stock’s price is high or low relative to its earnings and prospects. This way, you avoid overpaying for “hot” stocks that might be overpriced.
- Reduce Risk: By checking financial health and competitive position, you can spot red flags (like excessive debt or declining sales) before you invest. It’s better to do your homework than to lose money on avoidable mistakes.
In short, stock analysis for beginners is about getting the basics right so you can invest wisely from the start. Let’s break down the process into simple steps any beginner can follow.
Step 1: Understand the Company and Its Industry
Start with what the company does. Before crunching numbers, make sure you understand the business model: How does this company actually make money? In other words, what products or services do they sell, and to whom? Knowing the business model is crucial . For example, if you’re looking at a fast-food company, do they earn most of their revenue from selling food, or from franchise fees and royalties ? This helps you see where the company's money comes from.
Research the industry and market trends. A company doesn’t exist in a vacuum – its success can depend on its industry and the overall market climate. Ask yourself: Is this industry growing or shrinking? Look at the demand for the company’s products or services and any broader trends. For instance, if you’re analyzing a renewable energy stock, note if the clean energy sector is on the rise (favorable trend) or facing headwinds. Industry analysis provides context: consider the industry’s growth trajectory, customer demand, and any macroeconomic forces or regulations affecting it . Learning how the industry works – who the major competitors are, the company’s market share, and typical profit margins – will give you a deeper understanding of the company’s prospects .
Identify the company’s competitive advantage. Does the company have a moat (a sustainable edge over competitors)? This could be a strong brand, patented technology, a unique product, or operational efficiency. A long-term competitive advantage helps a company fend off competitors and keep growing . For example, Coca-Cola’s brand power and Microsoft’s dominance in operating systems created moats that protected their market share for years . For a beginner, you can identify moats by observing things like brand recognition (do people prefer this brand?), proprietary products, or high customer loyalty.
Examine the competition. Who are the company’s main competitors and how does it compare? If the company is one of the market leaders, that can be a positive sign. If it’s a smaller player, what is it doing differently to compete? Understanding the competitive landscape (who the major players are and their market shares) helps you gauge how hard it will be for your company to succeed . For instance, if you’re analyzing a new smartphone maker, consider how it stacks up against giants like Apple or Samsung in innovation and market share. Tip: One practical way to research a company and industry is to read the company’s annual report (10-K), especially the business description and risk factors sections. These often outline the industry conditions, competition, and the company’s strategy in plain English. You can find annual reports on the company’s Investor Relations website or on the SEC’s database (EDGAR).
Step 2: Check the Company’s Financial Health (Financial Statements)
Once you grasp what the company does and the industry context, it’s time to look at its financial health. A company’s financial statements are like its report card – they show you the money: where it comes from, how it’s spent, and what’s left .
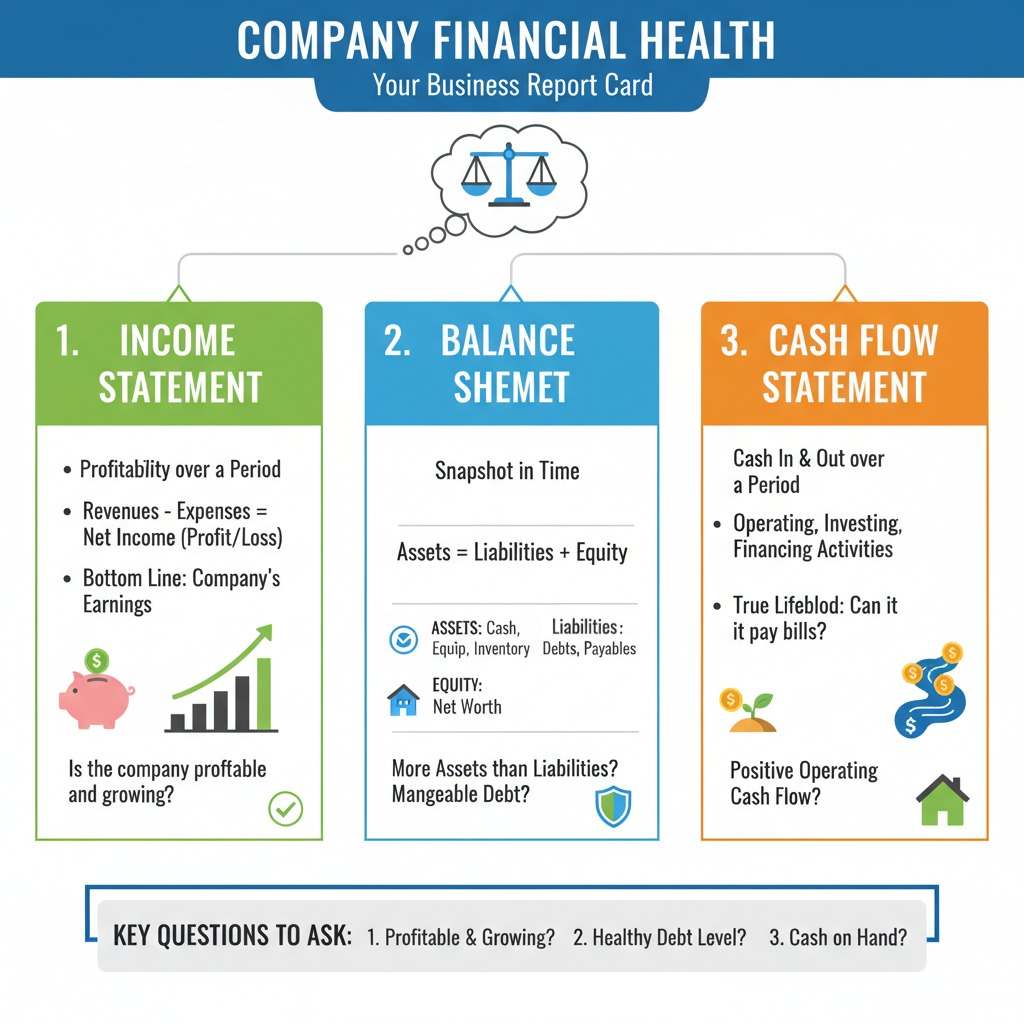
There are three key financial statements to know:
Income Statement
This shows how much money the company earned and spent over a period. It lists revenues (sales at the top), then subtracts expenses (costs of doing business) to arrive at net income (profit or loss). The “bottom line” of the income statement is the company’s earnings for that period . In short, the income statement tells you if the company is profitable, and by how much. Is the company’s revenue growing each year? Are profits (net income) growing or shrinking? A growing revenue and consistent profit are good signs that the business is doing well. (Think of it like your personal budget: income minus expenses equals what you save – a company wants that number to be positive and growing.)
Balance Sheet
This is a snapshot of what the company owns and what it owes at a specific point in time. It lists assets (like cash, equipment, inventory, etc.) and liabilities (debts, accounts payable, etc.), as well as shareholders’ equity (the net worth of the company). The balance sheet equation is Assets = Liabilities + Equity – meaning the company’s resources are funded either by borrowing (liabilities) or by shareholder investment (equity). For analysis, check if the company has more assets than liabilities (a sign of financial stability) and a reasonable level of debt. A company with a strong balance sheet (healthy cash reserves, manageable debt) is better equipped to handle downturns. For example, if a company has $1 billion in cash (asset) and $100 million in short-term debt (liability), it’s likely in a safer position than a company with only $50 million in cash but $500 million in debt.
Cash Flow Statement
This statement shows how cash moves in and out of the company over a period, divided into operating, investing, and financing activities. It answers questions like: Is the company actually generating cash from its business operations? How much did it spend on investments or receive from financing? Cash flow is critical because it’s the true lifeblood of a business – a company might show an accounting profit but still run out of cash. Investors often say "cash is king," because healthy cash flow means the company can pay its bills, invest in growth, and survive tough times . The cash flow statement is harder to “fake” than earnings, so it’s a great reality check . For beginners, a quick check is to see if operating cash flow is positive and ideally growing over time. Positive cash from operations indicates the company’s core business is actually bringing in cash, not just accounting profits.
These financial statements can sound complex, but remember: the basics aren’t difficult . Even a quick scan can give you valuable insights:
- Is the company profitable (positive net income) and for how many years?
- Are earnings and revenue growing year over year (showing momentum)?
- Does the company have a lot of debt relative to equity (which might be a risk if earnings drop)?
- Does it have a comfortable amount of cash on hand?
All publicly traded U.S. companies publish these statements every quarter (quarterly report) and year (annual report). You can find them in the company’s SEC filings (the 10-Q and 10-K reports) or simplified on finance websites. Pro tip: Websites like Yahoo Finance, Google Finance, and others provide key financial statement data and ratios for companies in an easy format , so you don’t need to calculate everything from scratch.
Step 3: Know the Key Financial Metrics (P/E, EPS, and More)
Beyond the raw financial statements, investors use financial ratios to evaluate a stock’s value and performance. As a beginner, you don’t need to know every ratio out there – but a few key metrics will go a long way in your stock analysis. Let’s look at two of the most important ones:
Earnings Per Share (EPS)
EPS is a measure of a company’s profitability per share of stock. It tells you how much profit the company earned for each share outstanding. The formula is simple: EPS = Net Profit / Number of Shares. For example, if a company made $100 million in profit and has 50 million shares, its EPS is $2.00. Generally, the higher the EPS, the more profitable the company is considered . EPS basically indicates how much money a company makes for each share of its stock . When analyzing a stock, check the EPS for recent years – is it growing? A rising EPS over time is a good sign because it means the company is increasing its profits (ideally, a company’s earnings should grow, which often leads to a higher stock price in the long run). Keep in mind that one company’s EPS is not directly comparable to another’s unless they have the same number of shares; instead, you usually compare EPS growth rates or use it in ratios like the P/E.
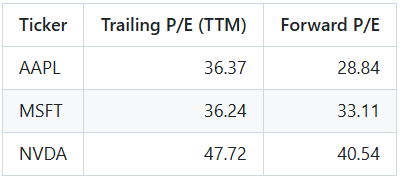
Price-to-Earnings (P/E) Ratio
The P/E ratio is one of the most popular valuation metrics in stock investing. It compares a company’s stock price to its annual earnings per share. In formula terms: P/E = Stock Price / EPS . What does this number mean? In plain language, the P/E ratio tells you how much investors are willing to pay for each $1 of the company’s earnings . For example, if a stock is trading at $50 and its EPS is $5, the P/E is 10 – investors are paying $10 for every $1 of earnings.
A high P/E ratio could mean the stock is expensive or “overvalued” relative to its current earnings, or it could mean investors expect high growth in the future . For instance, fast-growing tech companies often have high P/E ratios because people are willing to pay more today in hopes the company’s earnings will be much higher in the future.
A low P/E ratio could indicate the stock is cheap or “undervalued”, which might make it a bargain – or it could signal that the company is struggling and investors aren’t willing to pay much for it. A low P/E compared to the industry average can suggest a potential undervaluation, but you should investigate why it’s low (it could be low for a good reason, such as the company’s growth having stalled).
P/E is most useful when comparing companies in the same industry or looking at a company’s own historical P/E over time . What’s considered a “normal” P/E varies by sector and market conditions, but a common benchmark is the overall market’s P/E (historically, the average P/E of the stock market has often been around 15-20, though it fluctuates). If a company’s P/E is significantly higher than peers, be sure you believe in its growth story. If it’s significantly lower, ask if the market might be overlooking it or if the company has issues. Example: Suppose Company A has a stock price of $30 and an EPS of $2 (P/E = 15). Company B is $150 with an EPS of $10 (P/E = 15). And Company C is $10 with an EPS of $0.50 (P/E = 20). At first glance, Company C’s stock is the cheapest by price, but it’s actually the most “expensive” in valuation (paying 20 times its earnings) compared to A and B (where you pay 15 times earnings). Company A and B, despite very different stock prices, have the same P/E, meaning investors value their earnings similarly. This shows why looking at P/E is more insightful than just the dollar price of a share . In fact, in that example, Company C might be the priciest in terms of valuation because you pay $20 for $1 of its earnings, whereas for A and B you pay $15 for $1 of earnings.
Other Useful Metrics
While EPS and P/E are two big ones, beginners should be aware of a few other metrics:
- Revenue Growth: Is the company’s revenue (sales) increasing each year? Consistent growth in sales is a healthy sign of demand for the company’s products.
- Profit Margins: What percentage of revenue turns into profit? If a company has a 10% net profit margin, it means 10¢ of every $1 in sales is profit. Higher margins or improving margins mean the company is managing costs well.
- Debt Levels: Check the balance sheet for debt. A common metric is the debt-to-equity ratio (total debt divided by total shareholders’ equity). A high debt-to-equity ratio could mean the company is aggressively financed by debt, which can be riskier if earnings falter . Compare debt levels to peers; some industries (like utilities) normally carry more debt, while others (like tech) carry less.
- Dividend Yield (if applicable): If the company pays a dividend, the dividend yield tells you what percentage of the stock price is paid out as dividends annually. This can be relevant if you’re looking for income, though many beginner investors in growth stocks focus on reinvestment and price appreciation rather than dividends.
Remember, no single metric gives a full picture. It’s wise to look at a combination of factors. For instance, a stock might have a low P/E (which seems good), but if its earnings are expected to decline, that low P/E might be a value trap. Use multiple metrics together to cross-check a company’s health and value. Over time, you’ll get a feel for which numbers matter most for the type of stock you’re analyzing (e.g. tech startups might prioritize revenue growth, while mature companies might emphasize dividends and P/E).
While fundamentals tell you what to buy, technical indicators can help you decide when to buy. If you want to explore this side of analysis, check out our guide on how to combine RSI, MACD, and moving averages for smarter trade entries .
Step 4: Consider Qualitative Factors (Management and Moat)
Numbers tell a lot, but they don’t tell the whole story. Qualitative factors – the non-numeric aspects of a company – can be just as important to your analysis, especially for long-term investing. In fundamental analysis, you should consider both quantitative data (numbers) and qualitative factors (the company’s qualities) . Here are key qualitative factors for beginners to assess:
Management Quality
A company’s leadership and management team are crucial to its success. Even a great business idea can falter under poor management. While beginners can’t exactly interview CEOs, you can do a bit of homework: look up the CEO and top executives’ backgrounds on the company’s website or news. Have they successfully led companies before? Do they have a good reputation? Strong, experienced management that has a track record of honest and effective leadership is a positive sign . For example, if a CEO has a history of driving growth at other companies, that’s encouraging. Conversely, frequent scandals or high executive turnover could be red flags. (Tip: You can sometimes find a “Letter to Shareholders” in the annual report where management discusses performance and strategy – reading it can give you a feel for how they think and communicate.)
Competitive Advantage (Moat)
As mentioned earlier, identify what, if anything, gives the company an edge over competitors. Does it have a well-known brand that allows it to charge premium prices (like Apple’s brand appeal)? Does it own unique technology or patents that others can’t easily copy? Such moats help a company maintain long-term success . If you find that a company’s product is one you consistently love for its uniqueness, or you notice competitors struggle to match its quality or network (think of how eBay has a network of buyers/sellers that new entrants find hard to replicate), those are qualitative pluses.
Corporate Governance and Ethics
This is about how the company is run and whether it treats shareholders and stakeholders fairly. As a beginner, you might not dive deep into governance reports, but be mindful of any news about corporate scandals, lawsuits, or unethical behavior. You want to invest in companies that are run transparently and ethically. Stakeholder trust matters – if employees, customers, or suppliers have serious issues with the company, it could hurt the business in the long run . For instance, a company with a reputation for poor product quality or unhappy employees may eventually see financial results suffer.
Competitive Landscape
We touched on competition in Step 1, but it’s worth reiterating qualitatively. Is the company a disruptor in its field or an underdog? Sometimes a smaller company with an innovative approach can outmaneuver big incumbents (think how Netflix disrupted Blockbuster). Try to gauge if the company’s strategy gives it a unique position in the market. Also consider any threats – e.g., changes in technology that could make the company’s product obsolete, or new competitors entering the space. Reading industry news or even customer reviews can provide insight here.
External Factors
Qualitative analysis also means pondering things like regulatory environment (is the company heavily regulated or at risk of new regulations?), macroeconomic factors (if interest rates rise, does it hurt the company’s business?), and even social trends (is the company’s product becoming more popular with younger consumers, or is it a fading trend?). These factors aren’t in the financial statements, but they can influence future performance. For example, a company heavily reliant on fossil fuels might face headwinds as the world shifts toward green energy, which is a qualitative factor to weigh.
In summary, qualitative fundamentals include things like the company's business model, management effectiveness, brand value, and industry conditions . They complement the quantitative side (financial numbers). Many analysts consider both together for a fuller picture . As a beginner, trust your common sense observations too: If you use a company’s product and notice everyone around you does as well and loves it, that qualitative insight might encourage you to dig into that company’s quantitative data. Both perspectives together make for smart investing.
Step 5: Don’t Ignore Market Trends and Economic Conditions
While the focus of stock analysis is often on a specific company, it’s important to zoom out and look at the bigger picture. Broader market trends and economic conditions can heavily influence a stock’s performance:
Bull vs. Bear Markets
A bull market means stock prices in general are rising (investors are optimistic), whereas a bear market means prices are falling (investors are pessimistic). In a roaring bull market, even mediocre companies’ stocks might go up, and in a harsh bear market, even great companies’ stocks can drop. So always put a stock in context: is the overall market near all-time highs or in a slump? For beginners, this matters because you shouldn’t confuse a company’s performance with market-wide movements. If everything is down 20% due to a recession, a good stock might be down too – which could actually be an opportunity if its fundamentals are still strong.
Industry Cycles
Similar to broad market cycles, industries have ups and downs. For example, cyclical industries like automakers or airlines tend to do well when the economy is strong (people buy more cars, travel more) and poorly during recessions. If the stock you’re analyzing is in a cyclical sector, be mindful of where we are in the economic cycle. Is demand likely to pick up or slow down in the near future? On the other hand, some industries are more defensive, meaning they’re stable even in downturns (e.g., utilities or consumer staples like groceries – people need electricity and food in any economy).
Interest Rates and Inflation
Without getting too deep into economics, know that factors like interest rates can affect stock markets. When interest rates are low, stocks often become more attractive (because other investments like bonds yield less), and companies can borrow cheaply to fuel growth. When rates rise, it can put pressure on stocks, especially high-growth stocks, and make debt more expensive for companies. Inflation (rising prices) can also affect certain companies’ costs and consumers’ ability to spend. As a beginner, you don’t need to be an economist, but keep an ear on basic financial news. If you hear that the Federal Reserve is raising rates or that inflation is high, understand this could influence the market’s mood and thus stock valuations.
Market Hype and Sentiment
Sometimes, stocks move due to market sentiment rather than fundamentals. You might have heard of meme stocks or sudden spikes due to social media hype. Be cautious with these trends. If a stock you are considering is all over the news for speculative reasons (not because of its actual earnings or products), take a step back. Stick to your analysis of the real business value. Emotional trading by the crowd can create swings, but eventually prices tend to reflect fundamentals. As a beginner, it’s usually safer to focus on long-term value investing rather than short-term trading on trends.
In practice, considering market trends might mean: after doing your company analysis, you also ask “Is now a reasonable time to buy, given the market/industry conditions?” For long-term investors, there’s an argument that time in the market beats timing the market, meaning it’s hard to perfectly time when to buy. But you could make small adjustments: for example, if the entire market just had a big rally and stocks seem expensive, you might choose to buy slowly or wait for a dip. Conversely, if the market is down and you find a solid company, it could be a chance to buy at a discount. The key is context – know the environment you’re operating in. (Remember: even the best stock can be pulled down in a market crash, and a weak stock can be lifted in a bubble. By being aware of this, you won’t panic when external factors move your stock in the short term, and you can stay focused on the long-term value.)
Step 6: Practice, Patience, and Final Prep Before Buying
By now, you’ve covered understanding the business, reviewing financials, checking key metrics, weighing qualitative factors, and noting the market environment. Before you hit that “buy” button, here are a few final tips and steps for beginners:
Make a Checklist
It helps to have a simple checklist to ensure you’ve covered the basics of analysis. For example:
- Did I understand what the company does and how it makes money?
- Did I look at its revenue, profit, and EPS trends over the past few years?
- Did I check important ratios like P/E and perhaps compare them with competitors or the industry average?
- Did I read about any major news or red flags (lawsuits, new competitors, product recalls, etc.)?
- Do I believe in the company’s future prospects and management?
If you can answer these questions confidently, you likely have a good grasp on the stock.
Start Small
Even after analysis, remember that stock investing has risks and there are no guarantees. As a beginner, it’s often wise to start with a small investment in a stock to test the waters. This way, you can observe how the stock behaves and how you react to it (emotionally and strategically) without risking too much capital at once.
Diversify Your Investments
A classic rule is “don’t put all your eggs in one basket.” No matter how excited you are about a particular stock, avoid investing all your money into it. Spread your investments across a few stocks or sectors, or consider keeping a portion in broader funds or ETFs. Diversification helps smooth out risks because if one stock underperforms, others might do better. Realistic investing means accepting that not every pick will be a winner, so you back yourself up by not over-concentrating.
Use Finance Halo
Instead of juggling multiple platforms, you can streamline your research with Finance Halo. Our AI-powered stock analysis tool combines fundamental insights, technical indicators, and easy-to-read charts—all in one place. Whether you’re checking P/E ratios, running comparisons, or learning how to read financial statements, Finance Halo makes stock analysis accessible for beginners.
👉 Start using Finance Halo today and make smarter investing decisions.
Be Patient and Think Long-Term
Finally, investing is a long-term endeavor. After you buy a stock, its price might not go up immediately – it could even go down in the short term due to market fluctuations or an earnings miss. If you’ve done your homework and your original analysis still holds, try to resist the urge to panic-sell on short-term noise. Patience is key. Evaluate the stock’s progress over time by tracking its quarterly results and news. Adjust your analysis if something fundamentally changes (for example, if the company’s strategy shifts or a new competitor emerges).
By following these steps and tips, you’ll be analyzing stocks like a pro in no time. Remember, every expert investor was once a beginner who bought their first stock. The goal of this beginner’s guide is to give you the confidence to look at a company’s basics and make sense of them . With practice, you’ll get better at spotting what makes a stock a good opportunity or one to pass on. Now, let’s address some common questions new investors often have about analyzing stocks.
FAQ
What’s the first thing a beginner should look at when analyzing a stock?
Start with understanding the business itself. Before diving into numbers, make sure you know what the company does and how it makes money. This means reading about the company’s products or services, its industry, and its business model . If you can’t explain in simple terms how the company earns revenue, take a step back and research that first. After that, look at basic financial metrics like revenue, profit (net income), and earnings per share (EPS) to see if the company is profitable and growing.
How do I know if a stock is undervalued or overvalued?
One useful indicator is the Price-to-Earnings (P/E) ratio, which compares the stock’s price to its earnings. In general, a lower P/E relative to similar companies or the market average could suggest a stock is undervalued (cheaper for its earnings), while a higher P/E could indicate it’s overvalued (more expensive for its earnings) . However, “good” or “bad” P/E ratios are relative – they depend on the industry and the company’s growth prospects. For example, tech companies often have higher P/Es due to growth expectations. You should compare a company’s P/E to its peers and its own historical P/E. Also consider other metrics: for instance, a stock might have a low P/E but also have high debt or declining sales, which could explain the low valuation. It’s best to use a combination of factors (P/E, growth rates, book value, etc.) to judge valuation rather than any single number.
What does it mean if a company has no P/E ratio?
If you see “N/A” for P/E or it’s not defined, it usually means the company has no earnings (net profit) over the last 12 months. P/E = Price/Earnings, so if earnings are negative (a loss) or zero, the ratio isn’t meaningful . Many startups or high-growth companies might be losing money initially, so they’ll have no P/E. For a beginner, investing in companies with no earnings can be riskier because it’s harder to value them – you might then look at other measures like revenue growth or future earnings projections. Be cautious: a company without earnings relies on future profits materializing, which is not guaranteed.
What is the difference between fundamental and technical analysis?
Fundamental analysis involves evaluating a company’s financial health, business model, and qualitative factors to estimate its intrinsic value. You look at things like financial statements, earnings, growth, competitive position – basically everything we covered in this guide . It’s usually a longer-term approach, suited for investors deciding if a stock is a good value to buy and hold. Technical analysis, on the other hand, focuses on statistical trends in the stock’s price and trading volume. Technical analysts study charts, looking for patterns or indicators (like moving averages or trend lines) that might predict short-term price movements . It’s more about market psychology and timing trades than about the company’s fundamentals . In short: fundamental analysis asks “Is this a good company and is its stock undervalued?”, while technical analysis asks “What does the price chart say about trader behavior and trends?”. As a beginner focusing on stock analysis for beginners, you’ll likely want to start with fundamental analysis to ensure you’re investing in solid companies. Technical analysis can be used later if you’re interested in optimizing entry/exit points, but it’s not necessary for long-term investing.
Where can I find reliable information to research a stock?
Fortunately, there are plenty of beginner-friendly resources:
- Company Filings: The U.S. SEC’s website (EDGAR database) publishes all company reports (10-K annual reports, 10-Q quarterly reports, etc.). The SEC’s beginner’s guide is a great starting point to learn what these statements contain .
- Company Investor Relations: Most companies have an “Investors” section on their website where they post presentations, financial statements, and press releases. You can often find an overview of the business and strategy there, plus the latest earnings results.
- Finance Websites: Websites like Yahoo Finance, Google Finance, MarketWatch, or Morningstar provide a wealth of data – stock prices, charts, key ratios (P/E, EPS, etc.), analyst ratings, and news – all in one place . For example, by typing a company’s ticker symbol into Yahoo Finance, you can see its summary, charts, financials, and analysis tabs.
- Educational Resources: Investopedia is excellent for definitions and tutorials on any term (P/E, EPS, ROI – you name it). Brokerages like Fidelity, Charles Schwab, and Vanguard offer free articles and videos on how to research stocks . These sources are written for investors of all levels, including beginners.
- Analyst Reports and News: As you advance, you might read analyst research reports (some are available through brokerages) which can provide deeper insight into a company. However, for a beginner, it’s more important to focus on official data and your own understanding first, rather than blindly following an analyst’s opinion. Do keep an eye on news headlines for any major developments involving the company (like earnings releases, new product launches, CEO changes, etc.), as these can be make-or-break events for stocks.
Always prioritize information from credible sources (like SEC filings or established financial websites) over rumors on social media. When in doubt, cross-verify facts through multiple sources.
How much time should I spend researching a stock before buying?
There’s no hard rule, but as a beginner you might spend a few hours spread over days to research one stock thoroughly. This includes reading about the company’s business, glancing through an annual report or investor presentation, reviewing financial numbers, and reading some news or analysis pieces. Quality matters more than quantity of time – use a checklist to cover key areas (business, financials, valuation, qualitative factors). As you get more experienced, you’ll become faster at filtering important information. Importantly, never buy a stock under pressure or without understanding it. If you feel you haven’t grasped the company yet, take more time to research. Stocks aren’t going away, and it’s better to miss a short-term price jump than to rush in unprepared. Some investors follow a rule like “do at least one hour of research for every $1000 you plan to invest,” but it really depends on your comfort. Start with enough research that you could, say, explain to a friend why you’re buying this stock in a few bullet points. If you can’t, you might need to dig a bit more.
Should I rely only on one metric (like P/E) to make a decision?
No – relying on a single metric is not recommended. Each metric has its blind spots. For example, a low P/E might look attractive, but if those earnings come from a one-time sale of an asset (not from regular business operations), the P/E could mislead you. That’s why we emphasize a holistic analysis: look at multiple factors together. You might use P/E to gauge valuation, EPS growth to gauge profitability trend, debt levels to gauge risk, and qualitative factors to gauge business quality. By building a mosaic of information, you get a clearer picture. Think of it like a health check-up: you wouldn’t judge your health based on blood pressure alone; you’d also consider temperature, blood tests, etc. Similarly, with stocks, use a basket of metrics. In our guide we discussed EPS, P/E, revenue growth, profit margins, debt, etc. – taken together, they provide a much stronger basis for a decision than any one metric on its own.
Is it okay to buy stocks based on tips or should I always do my own analysis?
While it’s not uncommon to get stock tips from friends, TV, or social media, as a beginner you should be cautious with tips. A tip might point you to a potentially good stock, but you should still do your own analysis before buying. Everyone’s risk tolerance and investment goals are different – what’s good for one person might not be good for you. Moreover, tips can be fueled by hype or incomplete information. Always cross-check a tip: look up the company, read recent news, and see if the fundamentals actually support the positive claims. If someone says “Company XYZ is about to explode in price,” ask why? If you can’t find solid data or reasoning to back it up, be skeptical. In short, use tips as ideas for research, not as direct buy signals. The more you practice analyzing stocks yourself, the less you’ll feel the need to rely on tips.
How many stocks should a beginner invest in?
When starting out, it’s wise not to overload yourself. Even a portfolio of 5-10 stocks can be plenty for a beginner to manage and follow. This allows you to diversify a bit (so you’re not betting everything on one company or one industry) but also keep track of each investment. Each stock you own should be one you feel comfortable monitoring – you’ll want to stay updated on their quarterly results and news. If you have too many stocks, that can become overwhelming. Some beginners actually start with even just 1-3 stocks to really focus on learning (in addition to possibly owning some broad index funds for stability). As you gain experience, you can gradually add more positions. There’s no perfect number, but remember that diversification is important: for example, holding 10 stocks in different sectors is safer than 10 stocks all in the same sector like tech or banking. Diversify across industries and even types of companies (maybe some growth stocks, some stable dividend payers) to balance your risk. And don’t forget, you can also invest in index funds or ETFs alongside individual stocks to instantly get diversification while you learn stock-picking.
What if my analysis seems too hard or I don’t understand the financial statements well?
Don’t be discouraged – everyone starts somewhere. Financial statements have a learning curve, but the basics are learnable. If you find the official reports too dense, try these tips:
- Use summaries: Many finance websites summarize key financial data so you don’t have to parse a 100-page annual report right away. For instance, Yahoo Finance’s “Financials” tab will show you a simplified income statement, balance sheet, and cash flow statement for the past few years.
- Investopedia and Guides: Use Investopedia to clarify any term you don’t understand. There are also beginner books and online courses on stock investing that walk through financial statements step by step. The SEC’s beginner guide (which we cited) is written in plain language and is a great free resource .
- Practice on a company you know: It might be easier to start with a company whose products you use. For example, if you love a certain retail brand, look at their statements; it makes more sense when you can tie the numbers to real-world things (like you see “revenue” and you think “oh, that’s all the sales from the stores and online that I and others bought”).
- Focus on big picture numbers: In the beginning, focus on the major line items (Revenue, Net Income, Total Assets, Total Liabilities, Cash Flow from Operations, etc.) and their trends. You don’t need to decipher every footnote. You can get a good sense of financial health from those big numbers and growth rates.
- Ask for help: If you have a mentor or a friend who knows finance, don’t hesitate to ask them to explain something. Sometimes a 5-minute explanation from a person can clear up confusion that hours of solitary reading cannot.
Finally, remember that stock analysis is a skill – like riding a bike or cooking – it gets easier and more intuitive with practice. Start with one stock, take your time, and it will feel less hard as you go. Even professional analysts continuously learn and improve. So stick with it; the payoff (making informed investment decisions) is well worth the effort.
Conclusion
By following this guide and utilizing the resources mentioned, even a complete beginner can perform a basic stock analysis before buying. Stock investing becomes much less scary when you understand the core concepts of P/E ratios, EPS, market trends, financial statements, and qualitative factors. Keep learning, stay curious, and happy investing!