What Is a Good Price-to-Sales (P/S) Ratio?
6/4/2026
A "good" price-to-sales (P/S) ratio is one of the most misunderstood numbers in stock valuation. The honest answer is that it depends entirely on the industry, the growth rate, and the profit margin - and this guide shows you exactly how to read it.

What Is the Price-to-Sales (P/S) Ratio?
The price-to-sales ratio (P/S, sometimes written as the PSR) measures how much investors are willing to pay for each dollar of a company's revenue. It answers a simple question: if you bought the entire company today, how many years of sales would it take to equal the price you paid?
Unlike earnings-based metrics, the P/S ratio works even when a company has no profits. That is why it has become a favorite tool for valuing fast-growing technology firms, early-stage businesses, and cyclical companies whose earnings swing wildly from year to year. Revenue is the top line of the income statement, and it is much harder to manipulate than the bottom line.
The trade-off is that a low P/S ratio does not automatically mean a stock is cheap. A company can generate billions in sales while bleeding cash, and the P/S ratio would never warn you. For that reason, experienced investors treat P/S as a starting point rather than a verdict. If you are new to reading the income statement, our beginner guide to analyzing a stock before buying walks through where revenue sits and why it matters.
How to Calculate the P/S Ratio
There are two equivalent ways to calculate the P/S ratio, and both give the same answer. The most common version uses the company's total market capitalization divided by its trailing twelve months (TTM) of revenue:
The second version works on a per-share basis, which is handy when you only have the share price in front of you:
A Quick Worked Example
Imagine a company with 500 million shares outstanding trading at $40 per share, generating $5 billion in annual revenue. Its market capitalization is 500 million times $40, or $20 billion. Dividing by $5 billion in sales gives a P/S ratio of 4.0. In plain English, the market is paying $4 for every $1 of this company's sales.
You can use trailing revenue (the last twelve months, already reported) or forward revenue (analyst estimates for the next twelve months). Forward P/S is lower for growing companies because next year's sales are expected to be higher. Always compare apples to apples: do not pit one company's forward P/S against another's trailing P/S.
So What Is a Good P/S Ratio?
As a rough rule of thumb, a P/S ratio between 1 and 2 is generally regarded as reasonable, and a ratio below 1 is often considered a sign of potential undervaluation. A ratio approaching or exceeding 10 signals that investors are pricing in dramatic future growth - and leaving little margin for error.
But these numbers are blunt instruments. The single most important rule of the P/S ratio is this: it is only meaningful when compared to peers in the same industry and read alongside the company's growth rate and profit margin. A P/S of 3 might be a screaming bargain for a high-growth cloud software firm and wildly expensive for a grocery chain.
For context, the entire S&P 500 traded at a price-to-sales ratio of roughly 3.71 in May 2026, near the high end of its historical range. That broad-market figure is a useful yardstick: a large, mature company trading well above it should be earning that premium with superior margins or growth. The same logic applies to the P/E ratio and the PEG ratio - context beats absolute thresholds every time.
Good P/S Ratio by Industry (With a Table)
The clearest way to see why "good" is relative is to look at how P/S ratios spread across sectors. Across the 133 industries tracked in April 2026, average price-to-sales ratios ranged from roughly 0.20x to 8.40x. The table below summarizes typical ranges by business type.
| Industry / Business Type | Typical P/S Range | Why |
|---|---|---|
| Biotechnology | ~8.6x (highest avg) | Tiny current sales, huge potential pipeline value |
| SaaS / Cloud Software | 5x - 15x | Recurring revenue, high gross margins, fast growth |
| REIT - Industrial | ~7.7x | Asset-heavy with stable, high-quality rental income |
| Mature Technology | 3x - 8x | Solid margins, moderate growth |
| Consumer Staples | 1x - 3x | Predictable demand, modest margins |
| Retailers | 0.2x - 1.0x | Very thin net margins on huge sales volume |
| Paper & Paper Products | ~0.20x (lowest avg) | Commodity pricing, low margins, slow growth |
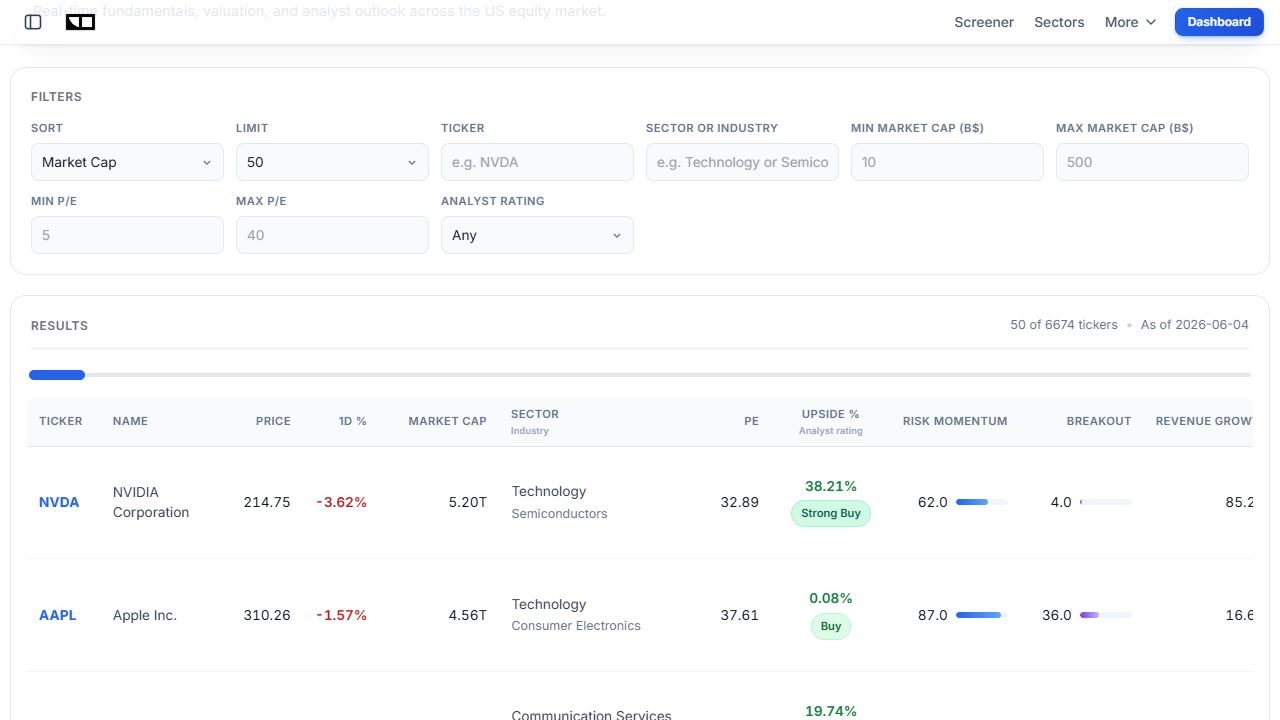
The takeaway is unmistakable: a P/S of 6 would be alarming for a retailer and unremarkable for a cloud software company. You can explore current fundamentals and valuation multiples for hundreds of names on the Finance Halo market screener, which lets you filter by sector and market cap before you ever compare a single ratio.
Why Does the P/S Ratio Vary So Much by Sector?
If two companies both earn $1 billion in revenue, why should one trade at 10x sales and the other at 0.5x? The answer comes down to two forces: profit margins and growth.
Profit Margins Set the Floor
Revenue is only valuable insofar as some of it becomes profit. A software firm might keep 30 cents of net profit on every dollar of sales, while a supermarket keeps two or three cents. Investors will naturally pay far more for the high-margin dollar of revenue because more of it eventually lands in shareholders' pockets. That is why software and pharma carry rich P/S multiples and grocers, airlines, and auto dealers carry tiny ones.
Growth Sets the Ceiling
The second force is growth. A company growing revenue 50% a year will, within a few years, have a much larger sales base - so today's high P/S can shrink quickly even if the stock price stays flat. This is the same logic behind the PEG ratio's growth adjustment for earnings: a multiple is only expensive relative to how fast the underlying number is expanding.
Capital Structure Adds Noise
Finally, debt distorts cross-company comparisons. The P/S ratio uses market capitalization, which ignores how much debt a company carries. Two firms with identical sales and identical P/S can have very different risk profiles if one is loaded with debt - a problem the EV/Sales ratio fixes, as we will see below.
P/S Ratio vs. P/E Ratio: When to Use Each
The price-to-earnings (P/E) ratio is the most quoted valuation metric, but it has a fatal flaw: it is useless when a company has no earnings. Many of the market's biggest winners spent years unprofitable on paper while growing revenue rapidly. For those companies, the P/S ratio is the only multiple that produces a usable number.
| Situation | Use P/S | Use P/E |
|---|---|---|
| Company is unprofitable or near break-even | Yes | No (no meaningful earnings) |
| Cyclical company with volatile earnings | Yes (revenue is steadier) | Risky (peak/trough distortion) |
| Mature, profitable company | Supplementary check | Yes (primary metric) |
| Comparing across very different margins | No (ignores profitability) | Yes (captures the bottom line) |
The smartest approach is to use both. The P/S tells you what you are paying for sales; the P/E tells you what you are paying for the profits those sales produce. When a stock looks cheap on P/S but expensive on P/E, the difference is its margin - and that gap is often where the real investment thesis lives. For a deeper look at earnings-based multiples, see our complete guide to a good P/E ratio by industry.
P/S vs. EV/Sales: Which Is More Accurate?
A close cousin of the P/S ratio is EV/Sales, which replaces market capitalization with enterprise value (market cap plus debt minus cash). Because enterprise value reflects what it would actually cost to acquire the whole business - paying off its debt and pocketing its cash - many professional analysts consider EV/Sales the more rigorous metric.
The practical difference shows up when two companies have very different balance sheets. A firm with a mountain of debt will look artificially cheap on P/S because its market cap is small relative to its sales, but EV/Sales reveals the true cost of ownership. Conversely, a cash-rich company can look expensive on P/S yet reasonable on EV/Sales once you net out its cash pile.
So which should you use? For a quick screen across companies with similar capital structures, P/S is faster and perfectly adequate. When you are comparing firms with meaningfully different debt loads - or sizing up a potential acquisition - EV/Sales gives the more complete picture. Neither metric should be used alone; both are inputs into a broader analysis like the framework in our deep value investing guide.
Real-World Example: Nvidia vs. Palantir
Nothing illustrates the P/S ratio better than two of the most talked-about AI stocks of 2026. Both are profitable, both are growing fast, and both command premium multiples - but the gap between them is enormous.
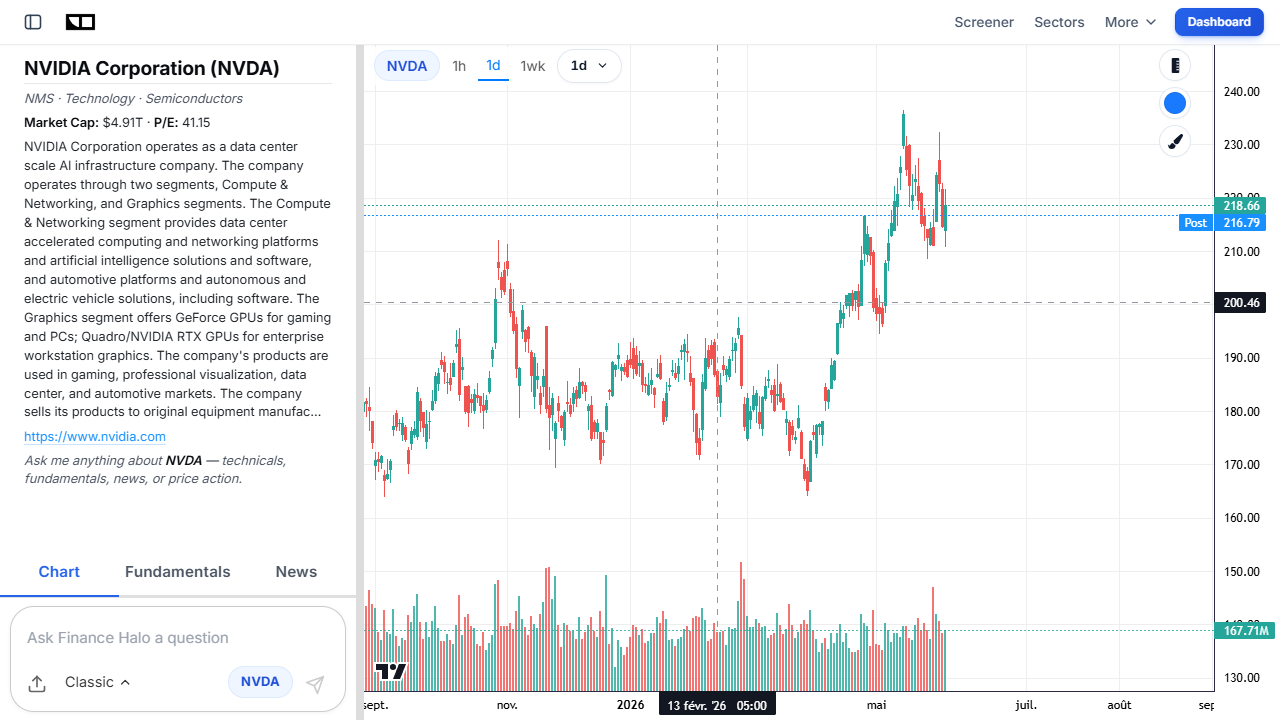
Nvidia: A High but Defensible Multiple
Nvidia (NVDA) traded at a price-to-sales ratio of roughly 23 in 2026, down from a peak above 30 in November 2025. On the surface, 23x sales sounds extreme. But Nvidia paired that multiple with 70%+ revenue growth, an extraordinary 75.2% gross margin, and nearly $97 billion in free cash flow. When a company converts three-quarters of every sales dollar into gross profit and is still compounding revenue at breakneck speed, a high P/S can be justified by the underlying economics.
Palantir: When the Multiple Outruns the Business
Palantir (PLTR) tells a more cautionary tale. The stock began 2026 with a price-to-sales ratio above 100, later cooling to the mid-60s. Even after that decline, a P/S near 67 means investors were paying $67 for every $1 of Palantir's sales. History is unkind to such valuations: research has repeatedly shown that few industry leaders sustain a P/S above 30 for long, and ratios at that level have historically preceded sharp corrections.
| Metric (2026) | Nvidia (NVDA) | Palantir (PLTR) |
|---|---|---|
| Approx. P/S ratio | ~23x | ~67x |
| Revenue growth | 70%+ | ~85% |
| Historical bubble threshold | Near the line | Far above it |
The lesson is not that Palantir is doomed or Nvidia is safe - it is that the same metric carries very different risk at 23x versus 67x. The higher the P/S, the more flawless the future has to be to justify today's price. You can check the current P/S and margins for either name yourself and ask the Finance Halo AI assistant about Nvidia's valuation in plain English.
The History: How Ken Fisher Popularized the P/S Ratio
The price-to-sales ratio owes its popularity to money manager Kenneth Fisher, who championed it in his 1984 book Super Stocks. Fisher observed that earnings could swing dramatically from year to year because of accounting choices and one-time charges, while sales were far more stable and a cleaner gauge of a company's underlying strength.
Fisher's original framework was strikingly simple. He treated a P/S below 0.75 as a strong buy signal and a P/S above 3.0 as a sell signal, hunting for "super companies" that had stumbled temporarily and were trading at depressed sales multiples. He also issued an important warning: he refused to apply the ratio to financial institutions like banks, whose revenue is a hybrid of net interest income and fees rather than ordinary product sales.
Markets have re-rated higher since the 1980s, so Fisher's exact thresholds no longer hold across today's higher-multiple market. But his core insight endures: revenue is a more honest, more durable starting point than earnings, especially for companies whose profits have not yet caught up to their growth.
How to Screen for a Good P/S Ratio
Knowing the theory is one thing; finding cheap stocks is another. Here is a practical, repeatable process you can run today.
- Pick a sector first. Never compare P/S ratios across unrelated industries. Decide whether you are hunting in software, retail, energy, or elsewhere.
- Find the sector's typical range. Use a benchmark source or a screener to see where the median company in that sector trades.
- Flag companies trading below their peers. A low P/S relative to the sector is your shortlist of potential bargains - not a buy list yet.
- Check the margin. Confirm the company actually makes money (or has a credible path to it). A low P/S with negative and worsening margins is a value trap.
- Confirm the growth. A low P/S paired with shrinking revenue is a warning, not an opportunity. A low P/S paired with rising revenue is the sweet spot.
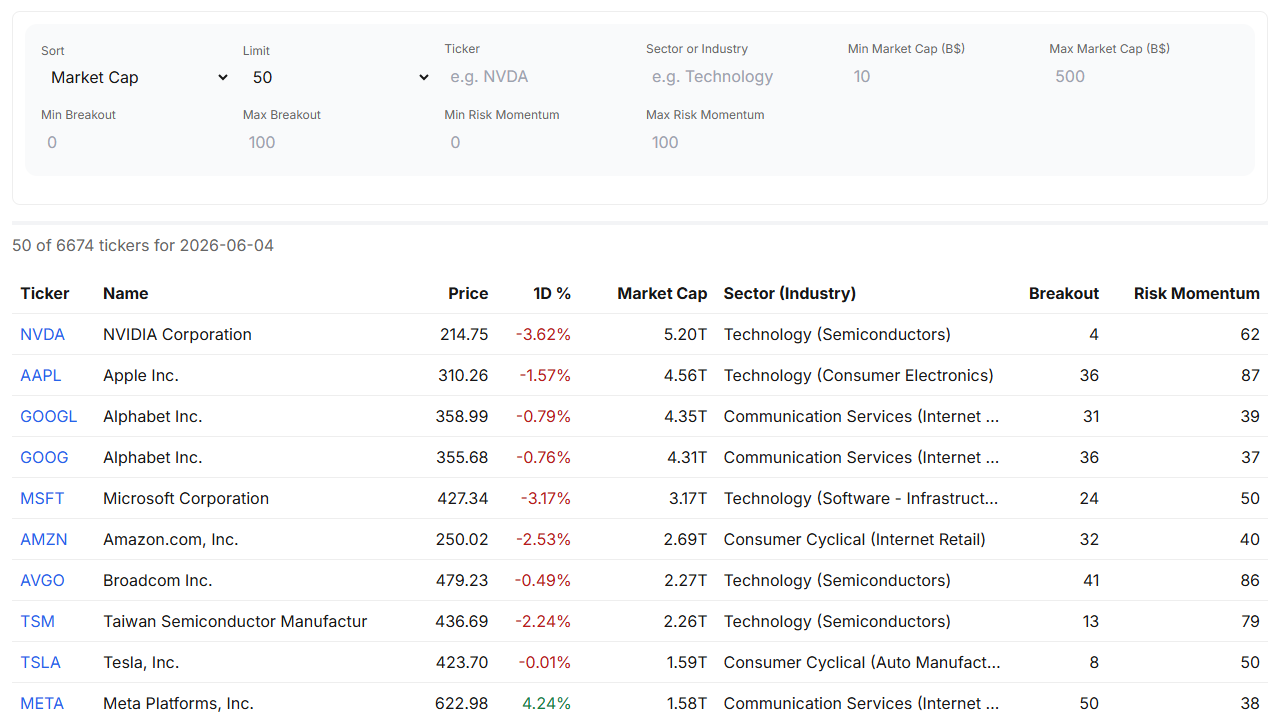
To speed this up, the Finance Halo Stock Scores screener ranks companies by a Deep Value score that blends sales-based and earnings-based cheapness, alongside Trend Following, Breakout, Volume Trendy, and Risk-Adjusted Momentum scores. It turns the five-step process above into a single sortable list. For the broader macro backdrop - which sectors are cheap and why - the AI-generated market intelligence dashboard is a useful companion.
Common Mistakes to Avoid
- Comparing across industries. Judging a retailer's 0.5x P/S against a software firm's 8x P/S is meaningless. Always compare within the same sector and business model.
- Ignoring profitability. A low P/S on a company that loses money on every sale is not cheap - it is a trap. Always cross-check the net margin.
- Forgetting about debt. P/S uses market cap, so a heavily indebted company can look cheaper than it really is. Glance at EV/Sales or the debt load before concluding anything.
- Treating a high P/S as automatically overvalued. A P/S of 15 can be reasonable for a 60%-growth, high-margin business. The multiple must be read against growth.
- Applying it to banks and insurers. As Ken Fisher warned, financial firms' revenue does not behave like product sales, so P/S is unreliable for them.
- Using a single ratio in isolation. P/S is one input. Combine it with the P/E, EPS, and PEG comparison, margins, and growth before acting.
Frequently Asked Questions
What is considered a good price-to-sales ratio?
A P/S ratio between 1 and 2 is generally seen as reasonable, and below 1 as potentially undervalued. However, a genuinely "good" ratio depends on the industry - high-margin software can deserve a P/S of 8 or more, while a low-margin retailer might be expensive at 1.
Is a low P/S ratio always better?
No. A low P/S ratio can signal a bargain, but it can also be a value trap if the company is unprofitable, shrinking, or burdened with debt. Always confirm that revenue is growing and that the business actually converts sales into profit.
What does a P/S ratio of 10 mean?
A P/S ratio of 10 means investors are paying $10 for every $1 of the company's annual sales. That is expensive for most sectors but can be justified for a rapidly growing, high-margin company where revenue is expected to multiply over the next few years.
What is the difference between P/S and P/E ratio?
The P/S ratio compares price to revenue (the top line), while the P/E ratio compares price to earnings (the bottom line). P/S works even when a company has no profits, making it ideal for early-stage or cyclical firms; P/E is better for mature, consistently profitable companies.
Why is the P/S ratio useful for unprofitable companies?
Because revenue exists even when earnings are negative or zero. Many high-growth companies are unprofitable on paper for years while scaling, and the P/S ratio gives investors a usable valuation anchor when the P/E ratio produces no meaningful number.
What is the main limitation of the P/S ratio?
Its biggest weakness is that it ignores profitability entirely. A company with enormous sales but no path to profit can look cheap on P/S while being a poor investment. It also ignores debt, which is why some analysts prefer EV/Sales.
Does the S&P 500 have a price-to-sales ratio?
Yes. The S&P 500's aggregate price-to-sales ratio was about 3.71 in May 2026, near the upper end of its historical range. It is a handy benchmark for gauging whether a large-cap stock is trading at a premium or discount to the broad market.
Should I use trailing or forward P/S?
Trailing P/S uses the last twelve months of actual revenue, while forward P/S uses analyst estimates for the next twelve months. Forward P/S is lower for growing companies. Just make sure you compare the same basis across companies - never trailing against forward.
Conclusion
So, what is a good price-to-sales ratio? The most accurate answer is: it depends on the industry, the margin, and the growth rate. A P/S between 1 and 2 is a useful default starting point, and below 1 often signals value, but these rules collapse the moment you compare a software firm to a supermarket. Biotechnology averaged 8.6x while paper products averaged 0.20x in 2026 - both can be perfectly "fair" for their business models.
Use the P/S ratio the way Ken Fisher intended: as a stable, hard-to-manipulate first screen, especially for companies whose earnings have not yet caught up to their revenue. Then layer on the three checks that turn it from a number into an insight - compare within the sector, confirm the margin, and verify the growth. Pair it with the P/E ratio and EV/Sales, and you will avoid the value traps that snare investors who rely on any single multiple.
Try it yourself: Analyze NVDA with Finance Halo's AI assistant to get instant valuation metrics, technical analysis, and the context behind the price-to-sales ratio in seconds.
Disclaimer: This article is for educational purposes only and does not constitute investment advice. Always do your own research before making investment decisions.