What Is a Good PEG Ratio? A Beginner’s Guide to PEG in Stock Valuation
10/18/2025
What Is a Good PEG Ratio? A Beginner’s Guide to PEG in Stock Valuation
A stock market display board illustrating rising and falling stock values. Investors often hear about the price-to-earnings ratio (P/E) when they start investing for beginners courses, but the PEG ratio is another key metric that adds an extra dimension to stock valuation. In the U.S. stock market, growth-oriented investors use the PEG ratio to determine if a company’s share price is reasonable compared to its earnings growth prospects. This beginner-friendly guide will explain what the PEG ratio is, how it’s calculated, what is considered a good PEG ratio, and how to use it in evaluating U.S. stocks. We’ll also discuss the differences between PEG and P/E and the limitations of relying solely on PEG. By the end, you’ll understand how this tool fits into a stock valuation toolkit for growth investing.
Understanding the PEG Ratio (Price/Earnings-to-Growth)
The price/earnings-to-growth (PEG) ratio is a stock valuation metric that combines a company’s P/E ratio with its earnings growth rate.
In simple terms, the PEG ratio is defined as a stock’s P/E (price-to-earnings) divided by the company’s expected earnings growth rate (usually expressed as a percentage). This means the PEG ratio factors in future growth expectations, providing a more complete picture than the P/E ratio alone, which focuses only on current earnings.
PEG vs. P/E: The PEG ratio essentially adjusts the P/E for growth. A standard P/E tells you how much investors are paying for each dollar of a company’s current earnings. However, P/E doesn’t tell you if that price is justified by the company’s growth prospects. By incorporating expected growth into the equation, the PEG ratio can reveal whether a stock’s price is reasonable given its future growth trajectory.
For example, two stocks might both have a P/E of 20, but if one is expected to grow earnings much faster, its PEG will be lower, indicating it’s a better value relative to its growth. In short, the PEG ratio “shines a spotlight” on growth by showing the trade-off between price and growth.
How to Calculate the PEG Ratio (with Example)
Calculating the PEG ratio is straightforward. The formula is: PEG Ratio = (P/E Ratio) ÷ (Annual EPS Growth Rate).
To calculate it yourself, you first need the company’s P/E ratio (which is the stock’s price per share divided by its earnings per share). Then, determine the earnings per share (EPS) growth rate (often an analyst-projected annual growth percentage for the next 1 to 5 years). Divide the P/E by the growth rate percentage. For example, if a stock has a P/E of 30 and its earnings are projected to grow by 20% annually, its PEG would be 30 ÷ 20 = 1.5.
This result of 1.5 means the stock’s price is 1.5 times its growth rate. Let’s illustrate with two hypothetical companies in the U.S. market:
| Company | Details |
|---|---|
| Company A | P/E ratio = 45, expected annual EPS growth = 50%. PEG = 45 ÷ 50 = 0.9. |
| Company B | P/E ratio = 15, expected annual EPS growth = 3%. PEG = 15 ÷ 3 = 5.0. |
Even though Company A has a much higher P/E, its PEG of 0.9 indicates the price is low relative to its high growth rate. Company B, despite a modest P/E, has a PEG of 5.0, indicating the stock price is very high compared to its tiny growth. In real-world terms, a fast-growing tech stock might resemble Company A, whereas a slow-growing utility or consumer staples stock looks like Company B in this scenario.
This example shows why the PEG ratio is so useful: a high-growth company can still be a bargain if its PEG is low, and a low-growth company can be overpriced if its PEG is high.
Using forward vs. trailing data: When calculating PEG, it’s important to be consistent about using forward-looking or historical data. Often, investors use forward PEG – which means using the forward P/E (based on projected earnings) and an expected future growth rate. Using a trailing (historical) growth rate with a current P/E can mislead, especially if a company’s future will differ from its past. Always check what period the growth rate covers (1-year, 3-year, 5-year, etc.) and use the same approach for fair comparisons. Different sources might report different PEG values for the same stock because they may use different growth horizons or estimates.
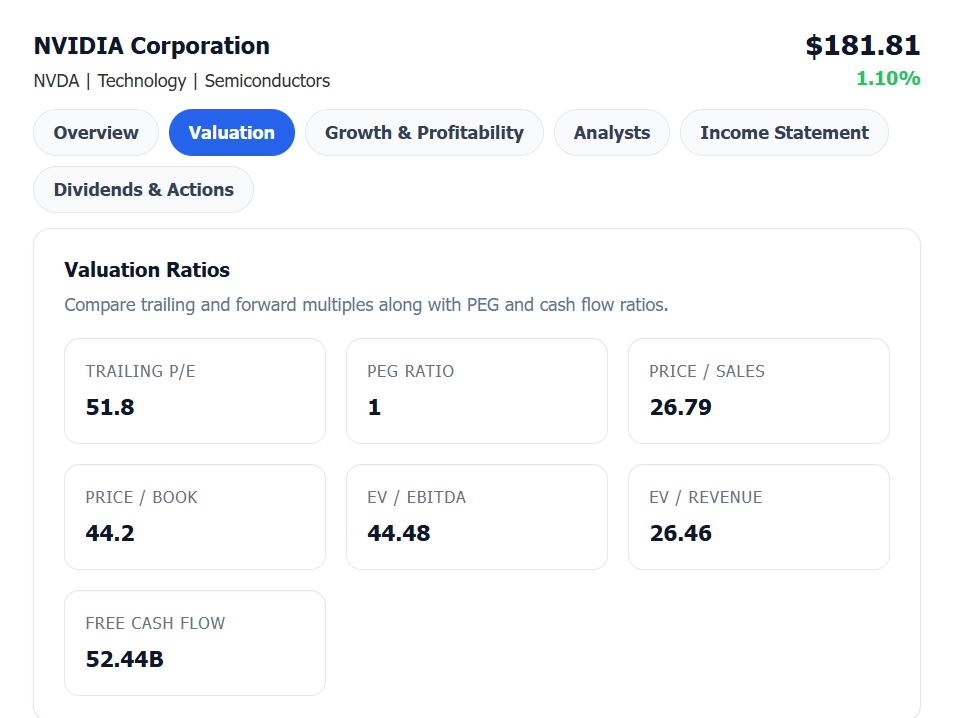
To make this concept clearer, let’s look at a real-world example. The chart below shows NVIDIA’s fundamentals as displayed in the Finance Halo app — which provides investors with up-to-date PEG ratio data for thousands of U.S. stocks. As of this snapshot, NVIDIA’s PEG ratio is around 1, meaning its stock price is roughly in line with its expected earnings growth — a balance that often indicates fair valuation for a high-growth company.
What Is Considered a Good PEG Ratio?
In general, a PEG ratio below 1.0 is considered good or favorable, as it suggests the stock may be undervalued relative to its expected growth. A PEG of 1.0 is often interpreted as “fair value,” meaning the stock’s price is reasonably in line with its growth rate. Meanwhile, a PEG significantly above 1.0 can be a warning sign that a stock is overvalued – its price might not be justified by its growth outlook.
Some analysts use specific benchmarks: for example, a PEG above 2.0 is generally viewed as high (potentially overpricing the stock) while a PEG in the 0.5–1.0 range may indicate a bargain for growth investors.
It was famed Fidelity investor Peter Lynch who popularized using the PEG ratio in what’s known as “growth at a reasonable price (GARP)” investing. Lynch’s rule of thumb was that a PEG of 1 or less was very good – the company’s growth rate was equal to or greater than its P/E ratio, indicating a potentially attractive value.
In other words, if a company’s earnings are growing as fast (or faster) than the price investors are paying for those earnings, it could be a sign of a good value stock. For example, if a company has a P/E of 25 and an expected growth rate of 25% (PEG = 1.0), it’s growing fast enough to justify that valuation. If the same company’s growth were 30% (PEG ≈ 0.83), many would consider it undervalued for its growth.
Keep in mind that “good” can vary by sector and market conditions. In high-growth sectors like technology, PEG ratios might often be around 1 or slightly above, whereas in slower sectors (like utilities), PEG ratios tend to be higher because growth rates are low. Thus, context matters – a good PEG ratio for a tech stock might differ from a good PEG for a utility stock. As a rule of thumb, though, the lower the PEG, the more attractive the valuation relative to growth.
Using the PEG Ratio to Evaluate Stocks
So how can beginner investors use the PEG ratio in practice? Here are a few key points for evaluating stocks with PEG:
- Compare within industries: It’s most useful to compare PEG ratios among companies in the same sector or industry. This controls for differences in typical growth rates. For instance, comparing a tech company’s PEG to another tech company’s PEG makes more sense than comparing tech to a utility. Investors often start by looking at P/E ratios to find reasonably priced stocks in a sector, then use the PEG ratio to filter for those that also have strong growth relative to their price.
- Identify undervalued growth stocks: A low PEG can highlight stocks where growth is being underappreciated by the market. If two companies have similar P/Es, but one has a much lower PEG, it may indicate that the market isn’t fully valuing its growth prospects. For example, if Stock X has a PEG of 0.8 while Stock Y (a peer company) has a PEG of 1.5, Stock X could be a candidate for a growth at a reasonable price opportunity. Growth investors looking for the next winner often seek PEG < 1 as a starting point.
- Use alongside other metrics: The PEG ratio should be one tool in your toolbox, not the only one. It provides a forward-looking valuation insight, but you should also consider other fundamentals. For instance, check the company’s financial health (debt levels, cash flow) and other valuation ratios like price-to-book (P/B) or price-to-sales. A stock might have a low PEG because its P/E is low – which could be due to some hidden risks or one-time issues. Always investigate why a company’s PEG is low: Is it genuinely undervalued, or are there concerns about whether it can actually achieve the expected growth?
- Assess the quality of growth estimates: Remember that PEG relies on earnings growth projections. Look at how realistic those projections are. It can help to review the company’s past growth consistency and the source of the growth estimate. A PEG calculation using overly optimistic analyst forecasts might make a stock look cheaper than it really is. As a beginner, you can find growth estimates on financial websites or in analysts’ reports – but it’s wise to be slightly skeptical and consider a range of scenarios. If a company’s PEG is low because analysts predict very high growth, ask yourself if that growth is feasible (consider the company’s business model, competition, etc.).
- Cross-sector comparisons: One neat feature of PEG is that it can sometimes allow comparisons across sectors by normalizing for growth. For example, a tech company with a high P/E might still have a lower PEG than a consumer goods company with a moderate P/E, suggesting the tech stock is actually better value for growth. However, use caution here – sectors differ in stability and predictability of earnings. PEG is particularly insightful for growth stocks and less so for mature, low-growth companies (more on this in limitations below).
By incorporating the PEG ratio into your stock analysis, you get a more balanced view: not just “Is this stock cheap or expensive now?” but “Is it cheap or expensive given how fast it’s growing?” This helps you avoid the trap of buying a stock that looks cheap on P/E but has poor growth prospects, or conversely, dismissing a high-P/E stock that actually has exceptional growth potential.
Limitations of the PEG Ratio
Like any single metric, the PEG ratio has its limitations. It’s important not to rely on it in isolation. Here are some key limitations and caveats to keep in mind:
- Reliance on forecasts: The PEG ratio is only as accurate as the earnings growth estimates it uses. These are ultimately predictions about the future, which can be wrong. Analysts’ growth forecasts can be overly optimistic or uncertain, so a PEG might paint an overly rosy picture if those projections don’t pan out. In other words, the PEG provides an illusion of precision by using a specific growth rate, but that growth rate isn’t set in stone. Always remember that a PEG is based on expected growth, which may change due to new business developments or economic conditions.
- Not useful for negative values: If a company has a negative P/E ratio (due to negative earnings) or a negative expected growth rate, the PEG ratio becomes not meaningful or is negative. A negative PEG typically signals a company with either losses or anticipated earnings decline, which generally means the stock is struggling. In such cases, PEG isn’t helpful for evaluation – other analysis is needed to understand the situation. Many screeners will simply show “N/A” for PEG if the inputs don’t make sense.
- Ignores other fundamentals: The PEG ratio focuses on price and earnings growth, but it doesn’t consider other important factors like a company’s debt, profit margins, or assets. For example, a firm may have a low PEG but also carry high debt or thin profit margins – factors that could hinder future growth or add risk. Similarly, PEG doesn’t account for any asset value on the balance sheet (cash, real estate, etc.) that might make a company more valuable than earnings alone suggest. To get a fuller picture, investors might look at metrics like the debt-to-equity ratio, price-to-book (P/B) ratio, or free cash flow in addition to PEG.
- Less meaningful for low-growth or cyclical companies: PEG shines in evaluating growth companies, but it’s less informative for mature or low-growth companies. Stocks in sectors like utilities or consumer staples often have low growth rates, which can result in very high PEG ratios (even if those stocks are stable and pay good dividends). A utility stock might always show PEG above 3 or 4 simply because its expected growth is only a few percent – that doesn’t automatically make it a bad investment, it’s just a different kind of investment. Thus, for dividend-focused or cyclical companies, PEG might not be the best yardstick. It also doesn’t easily accommodate situations where growth comes in bursts (cyclical industries where high growth years alternate with low growth years).
- Variability in calculation: Different analysts or websites may use different time frames for the growth rate (1-year forward, 5-year CAGR, etc.), leading to different PEG values for the same stock. There’s no universal standard for which growth period to use. This means you should double-check what growth assumption is behind a PEG figure you see quoted. Ensure you’re comparing apples to apples – for example, use the same 5-year growth horizon for all stocks you compare, if possible.
Bottom line: The PEG ratio is a valuable tool for adding a growth perspective to stock valuation, but it should not be used in isolation. Think of it as one piece of the puzzle. A very high PEG (>1) can steer you away from overpriced growth, and a low PEG (<1) can highlight potential bargains, but always validate with further research. Consider the company’s business quality, the reliability of growth estimates, and other valuation measures before making an investment decision.
FAQ
Q: What does the PEG ratio tell you, and how is it different from the P/E ratio?
A: The P/E ratio tells you how much investors are paying per dollar of a company’s earnings, but it doesn’t account for growth. The PEG ratio goes a step further by dividing the P/E by the earnings growth rate, so it shows whether a stock’s price is reasonable given its expected future growth. In essence, PEG combines value and growth into one number, which helps you compare high-growth companies to slower ones more fairly.
Q: What is a “good” PEG ratio value for a stock?
A: Generally, a PEG ratio below 1.0 is considered good or favorable. This suggests the stock price is low relative to the company’s growth rate (potentially an undervalued opportunity). A PEG around 1.0 is considered reasonable or fair value, and a PEG above 1.0 (especially well above, like 2+) might be a warning that the stock is expensive relative to its growth. Always remember these are guidelines, not hard rules – context matters by industry and growth stability.
Q: Is a PEG ratio below 1 always a buy signal?
A: Not necessarily. A PEG below 1 is a positive sign that a stock might be undervalued for its growth, but it’s not a guarantee of a great investment. Sometimes a low PEG happens because analysts expect very high growth that may not actually happen. If those growth forecasts are too optimistic, the stock could disappoint despite its low PEG. Additionally, other problems (like high debt or one-time earnings boosts) could make a stock look cheap on PEG when it’s actually risky. Use PEG as a starting point, but do additional research on why the PEG is low.
Q: Can a PEG ratio be negative, and what does that mean?
A: Yes, a PEG can be negative in rare cases – this typically occurs if the company’s earnings or growth rate is negative. For example, if a company is losing money (negative earnings) or expected to have earnings decline, the formula yields a negative number. A negative PEG ratio is generally a red flag indicating the company is struggling (either currently unprofitable or shrinking). In practice, investors don’t usually compare negative PEGs; instead, they’d investigate what’s causing the losses or declines in that company.
Q: Should I rely solely on the PEG ratio when evaluating a stock?
A: No – you shouldn’t rely on PEG alone. The PEG ratio is a helpful tool, but it’s just one metric. It doesn’t capture everything about a company’s financial health or investment potential. It’s best to use PEG alongside other measures like the P/E ratio, P/B ratio, debt levels, and understanding the company’s business model. By looking at a variety of indicators, you’ll get a more well-rounded view. Think of PEG as one angle of analysis: it tells you about price relative to growth. You should also consider factors like profitability, competitive advantages, industry conditions, and whether the expected growth is realistic. Combining these insights will lead to smarter investing decisions.
Conclusion
Bottom line: The PEG ratio is a valuable tool for adding a growth perspective to stock valuation, but it should not be used in isolation. Think of it as one piece of the puzzle. A very high PEG (>1) can steer you away from overpriced growth, and a low PEG (<1) can highlight potential bargains, but always validate with further research. Consider the company’s business quality, the reliability of growth estimates, and other valuation measures before making an investment decision.