Forward P/E vs Trailing P/E: Which Matters More?
6/7/2026
Forward P/E vs trailing P/E is one of the first real forks in the road for any investor learning to value a stock. One looks backward at proven earnings, the other forward at a forecast - and in a market trading near record valuations, knowing which to trust can save you from buying a story that never arrives.
Forward P/E vs Trailing P/E: The Core Difference
The price-to-earnings ratio answers a simple question: how much are you paying for each dollar of a company's profit? The only thing that separates forward P/E vs trailing P/E is which dollar of profit you put in the denominator - the one the company already earned, or the one analysts think it will earn next.
Trailing P/E (often labeled "P/E (TTM)" for trailing twelve months) uses actual, reported earnings per share from the past four quarters. It is grounded in audited facts, so it cannot be talked up by a hopeful narrative. The trade-off is that it is, by definition, a rear-view mirror.
Forward P/E uses the consensus analyst estimate for the next 12 months of earnings. It tries to price the business you are actually buying - the future one - but it inherits every flaw of the forecast behind it. If you are still building your foundations, our guide to what counts as a good P/E ratio is the ideal companion to this comparison.
| Attribute | Trailing P/E | Forward P/E |
|---|---|---|
| Earnings used | Last 12 months (actual) | Next 12 months (estimated) |
| Data source | Audited financial statements | Analyst consensus forecast |
| Reliability | High - based on facts | Variable - based on forecasts |
| Best for | Stable, mature companies | Growth companies with rising earnings |
| Main weakness | Ignores future changes | Forecasts are often too optimistic |
| Typical level for a grower | Higher | Lower |
How to Calculate Each P/E Ratio
Both ratios share the same numerator - the current share price - and differ only in the earnings figure underneath. The formulas are simple enough to compute on a napkin.
Trailing P/E formula
Add up the most recent four quarters of diluted EPS and divide the price by that sum:
If a stock trades at 100 per share and earned 5 in EPS over the past year, its trailing P/E is 20. You are paying 20 times last year's profit.
Forward P/E formula
Swap reported EPS for the analyst estimate of next year's EPS:
Take the same 100 stock. If analysts expect EPS to climb from 5 to 8 next year, the forward P/E drops to 12.5. The lower number reflects the growth the market expects, not a cheaper stock.
Why the two diverge
For a company with growing profits, estimated future EPS is larger than past EPS, so the forward P/E sits below the trailing P/E. When forward P/E is higher than trailing P/E, the market expects earnings to fall - a quiet warning sign worth chasing down. To see EPS, growth, and both ratios side by side for any name, you can screen the fundamentals directly on the Finance Halo market screener.
What Is a Good Forward P/E vs Trailing P/E?
There is no universal "good" number - context is everything. A P/E that looks expensive for a utility can look cheap for a fast-growing software company. Still, benchmarks help frame the conversation.
Historically, the S&P 500 has traded around a trailing P/E in the high teens to low 20s. As of May 2026, the index's trailing P/E (TTM) sits near 25.9, while the forward P/E based on next-12-month estimates has run around 21.5. The forward figure is lower precisely because analysts expect earnings to keep growing.
- Below 15 (forward): often considered value territory, but verify the growth outlook is not deteriorating.
- 15-25 (forward): a typical range for the broad market and steady compounders.
- Above 30 (forward): a growth premium - you are paying up for expected expansion that must materialize.
Because a "good" ratio is industry-dependent, pair this with our breakdown of good P/E ratios by industry and the broader P/E vs EPS vs PEG comparison so you are comparing apples to apples.
Why Can Trailing P/E Mislead You?
Trailing P/E feels safe because it is built on real numbers, but "factual" is not the same as "relevant." The past 12 months can be a poor guide to the next 12 in several common situations.
It punishes turnarounds
A company emerging from a bad year carries depressed trailing earnings, inflating its trailing P/E to a scary-looking number. If profits are about to recover, the forward P/E may already be reasonable while the trailing figure screams "expensive."
One-off events distort it
A large legal settlement, asset write-down, or one-time tax charge can crush a single year's EPS and send trailing P/E to an extreme. The ratio then describes an accounting event, not the underlying business.
It lags fast-moving stories
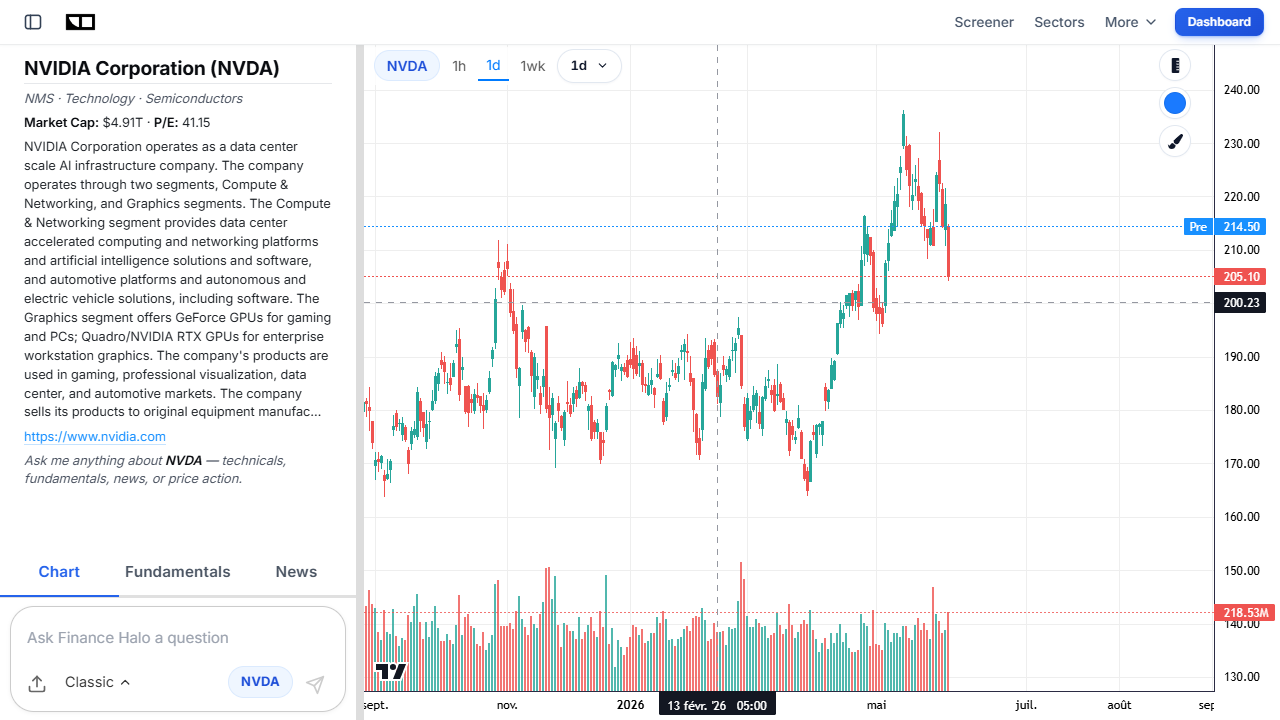
For a company whose earnings are doubling, last year's profit is almost irrelevant. This is why a name like NVIDIA (NVDA) can show a frightening trailing P/E that collapses to something far more digestible on a forward basis. Learning to spot these gaps is a core skill covered in our guide on how to analyze a stock before buying.
Why Can Forward P/E Mislead You?
If trailing P/E is the rear-view mirror, forward P/E is the weather forecast - useful, but wrong often enough to keep an umbrella handy. Its single biggest flaw is that it relies on analyst optimism.
An empirical study of analyst forecasts across global markets found that, over a 12-year span, 12-month earnings estimates were optimistically wrong by an average of 25.3%. In plain terms, analysts as a group tend to pencil in more profit than companies actually deliver. That bias makes forward P/E look cheaper than the stock will turn out to be once reality lands.
- Estimate risk: a forward P/E of 18 built on a too-rosy forecast might really be a 24 once results disappoint.
- Revision risk: estimates move constantly; a forward P/E quoted today can shift sharply after a single earnings report or guidance cut.
- Cyclical blind spots: analysts often miss the timing of downturns, leaving forward estimates - and forward P/E - too high right before earnings roll over.
The takeaway is not to ignore forward P/E, but to ask who is making the forecast and how reliable their track record has been for that company and sector.
Forward vs Trailing P/E in the 2026 Selloff
Mid-2026 is a near-perfect classroom for this debate. The S&P 500's Shiller CAPE ratio - a cyclically adjusted, 10-year version of P/E - reached roughly 39.8 in early June 2026, more than double its long-run median near 16 and the highest reading since the dot-com peak of December 1999. By that lens, the market is historically expensive.

Yet the forward P/E around 21.5 looks far less alarming, because it assumes another year of strong earnings growth - much of it from the AI complex. That gap is exactly what fueled volatility in early June, when a soft AI-chip outlook and a hot jobs report triggered a roughly $1 trillion single-session wipeout in semiconductors. When growth expectations wobble, the optimistic forward number snaps back toward the sober trailing one. We unpacked that dynamic in detail in Is the AI Trade Cracking? Inside June's Selloff.
The lesson: in a richly valued market, a low forward P/E is doing a lot of heavy lifting on assumptions. If you want to see how today's macro backdrop and sector positioning fit together, the daily AI-generated market intelligence report ties valuation to the broader regime.
Real-World Example: NVIDIA vs Tesla
Two of the most-watched growth stocks of 2026 show how forward P/E can clarify - or flatter - a valuation.
NVIDIA: forward P/E that earns its premium
NVIDIA (NVDA) entered 2026 with a trailing P/E that looked steep after years of explosive AI-driven earnings. But with profits still compounding, its forward P/E was projected to fall below 25. Here, the gap between trailing and forward is justified by genuine, broadly achievable earnings growth - the forward number is doing honest work.
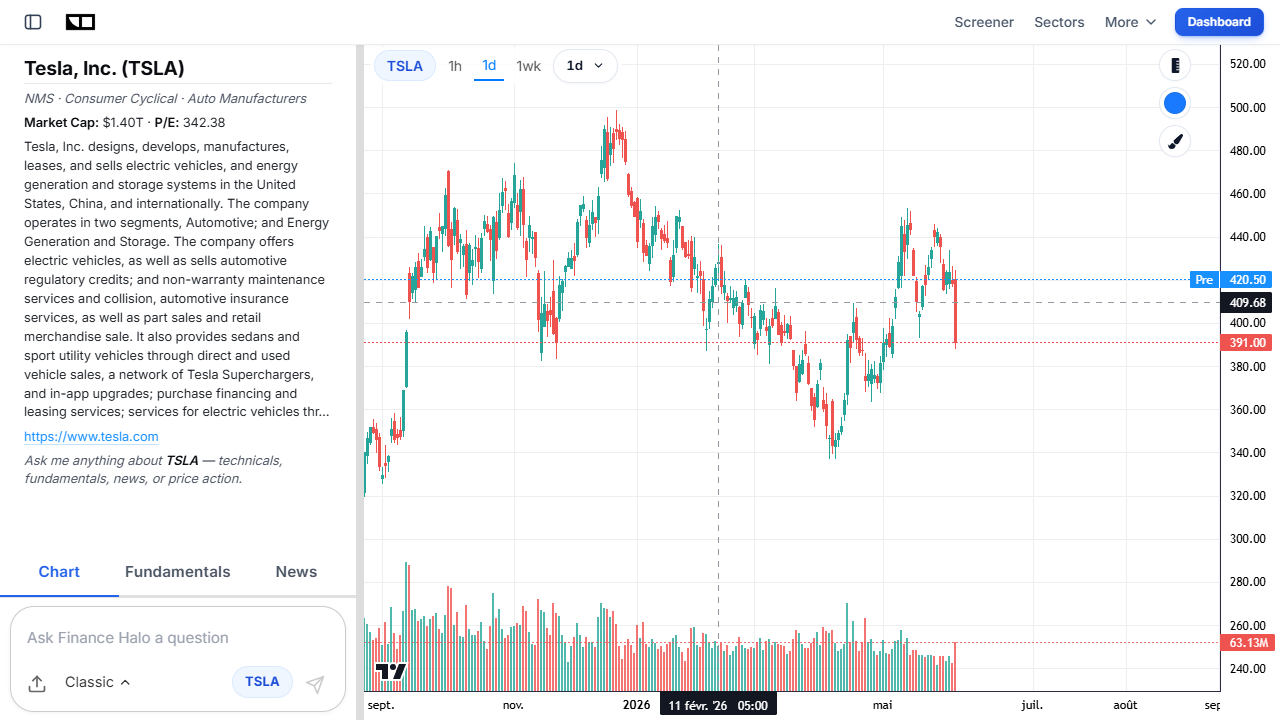
Tesla: forward P/E that still screams expensive
Tesla (TSLA) is the cautionary twin. Even on a forward basis, the stock has traded near a P/E of 292.9, with consensus calling for 2026 EPS of about 2.25 (up from roughly 1.65 in 2025). When a multiple stays in the triple digits even after baking in optimistic growth, the forward P/E is not making the stock look cheap - it is confirming how much speculative, narrative-driven value is embedded in the price.
| Stock | Approx. forward P/E (2026) | What it tells you |
|---|---|---|
| NVIDIA (NVDA) | Below ~25 | Premium backed by large, achievable earnings growth |
| Tesla (TSLA) | ~292.9 | Valuation rests on speculative AI/robotics narratives |
| S&P 500 (index) | ~21.5 | Broad-market benchmark for context |
Same metric, opposite conclusions. That is why forward P/E is a starting point for questions, not a verdict on its own.
Which P/E Ratio Should You Actually Use?
The honest answer is both - and the relationship between them is more informative than either number alone. A practical framework:
- Start with trailing P/E to anchor on what the company has actually proven it can earn.
- Add forward P/E to see how much growth (or decline) the market is pricing in for the year ahead.
- Compare the gap. A forward P/E well below trailing implies expected growth; a forward above trailing implies expected shrinkage.
- Stress-test the forecast. Ask whether the estimated EPS is plausible given the company's history and the sector's track record for analyst accuracy.
- Layer in growth-adjusted metrics. Because P/E ignores growth rate, pair it with the PEG ratio - see what is a good PEG ratio - to judge whether the premium is reasonable.
For mature, slow-changing businesses, trailing P/E carries more weight. For fast growers, turnarounds, and cyclicals near an inflection, forward P/E is often the more relevant lens - provided you trust the estimates.
How to Screen Stocks Using Both Ratios
Reading two ratios on one stock is easy; the edge comes from screening hundreds at once and surfacing the gaps worth a closer look. A repeatable workflow:
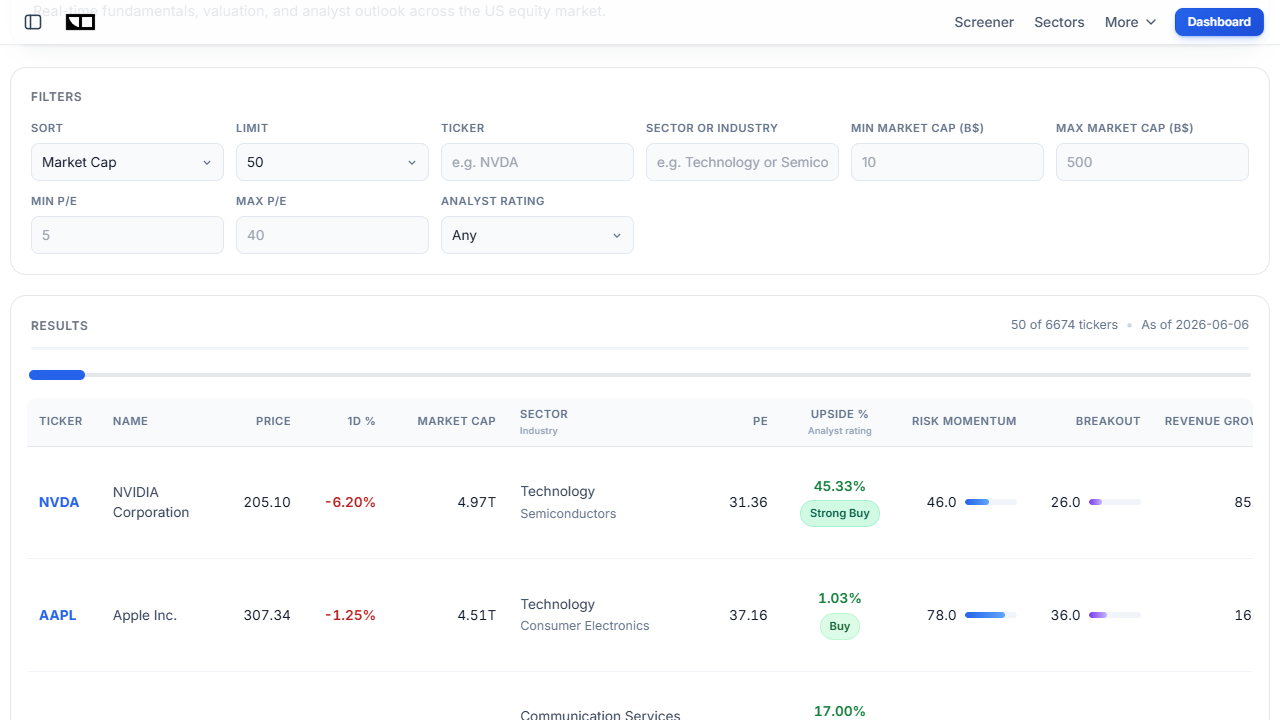
- Filter by P/E range first. On the Finance Halo screener, set a P/E range that matches your strategy - low for value, moderate for quality growth.
- Narrow by sector. Compare a bank to other banks and a chipmaker to other chipmakers; cross-industry P/E comparisons are meaningless.
- Flag big trailing-vs-forward gaps. A large drop from trailing to forward flags a market-expected growth story to verify - or a too-optimistic forecast to be skeptical of.
- Cross-check quality. Pair the P/E read with margins and balance-sheet strength so you are not buying a cheap-looking but deteriorating business. Our deep value stocks guide walks through that screen.
- Ask the AI. Drop any ticker into the chart page and ask Finance Halo's assistant to explain why the forward and trailing P/E differ for that specific name.
Common Mistakes to Avoid
- Treating forward P/E as fact: it is a forecast. Remember the ~25.3% average optimism bias and discount accordingly.
- Comparing across industries: a forward P/E of 12 for a software firm and 12 for an oil major mean completely different things. Always compare within a sector.
- Ignoring the growth rate: a high P/E can be cheap if growth is fast, and a low P/E expensive if earnings are falling. Use PEG to bridge that gap.
- Using P/E on unprofitable companies: with negative or near-zero earnings, P/E breaks down - switch to price-to-sales or EV/EBITDA.
- Forgetting one-off distortions: a single charge or windfall can warp trailing P/E. Check whether earnings were "clean."
- Anchoring on a single number: P/E is one input. Combine it with EPS trends, debt, cash flow, and the broader market regime before deciding.
Frequently Asked Questions
Is forward P/E or trailing P/E more accurate?
Neither is "more accurate" - they measure different things. Trailing P/E is precise because it uses reported earnings, but it can be irrelevant for fast-changing companies. Forward P/E is more relevant to the future you are buying, but it relies on estimates that are frequently too optimistic. The most reliable read comes from using both.
Why is forward P/E usually lower than trailing P/E?
For a company with growing earnings, the estimated future EPS in the forward calculation is larger than the past EPS in the trailing calculation. A bigger denominator produces a smaller ratio, so the forward P/E sits below the trailing P/E. If the forward P/E is higher, the market expects earnings to decline.
What is a good forward P/E ratio?
It depends on the industry and growth rate, but a forward P/E roughly in the 15-25 range is common for the broad market. Below 15 may signal value (verify the growth outlook is intact), while above 30 reflects a growth premium that future earnings must justify. As of 2026, the S&P 500's forward P/E sits around 21.5.
Can I rely on forward P/E alone to pick stocks?
No. Because forward P/E embeds analyst optimism, using it in isolation can make a stock look cheaper than it is. Combine it with trailing P/E, the PEG ratio, profit margins, and balance-sheet quality before making a decision.
What does it mean when forward P/E is higher than trailing P/E?
It means analysts expect the company's earnings to fall over the next 12 months. A rising P/E on shrinking earnings is often a warning sign, common in cyclical businesses approaching a downturn or companies facing structural pressure.
Which P/E do financial sites usually display by default?
Most sites show the trailing P/E (often labeled "P/E (TTM)") because it uses confirmed data. Forward P/E is typically listed separately as "Forward P/E" or "P/E (FWD)." On the Finance Halo screener you can view the underlying fundamentals to compute and compare both.
How often do forward earnings estimates change?
Constantly. Analysts revise estimates after earnings reports, guidance updates, and major economic news. Because the forward P/E moves with those revisions, a number you see today can look materially different a few weeks later - one reason to re-check before acting.
Conclusion
The forward P/E vs trailing P/E question does not have a single winner - it has a correct method. Trailing P/E tells you what a company has proven; forward P/E tells you what the market is betting on next. The most valuable signal is the gap between them: a wide spread reveals exactly how much future growth is baked into today's price, and whether that bet looks achievable or aspirational.
In a 2026 market trading near its highest valuations since 1999, that distinction is not academic. A reassuring forward P/E can quietly rest on optimistic forecasts that vanish the moment growth disappoints - as June's chip selloff demonstrated. Use both ratios, compare within industries, stress-test the estimates, and pair P/E with growth-adjusted metrics like PEG before you commit capital.
Try it yourself: Use Finance Halo's AI assistant to get instant analysis on any stock. Just type a ticker and ask it to break down the forward P/E vs trailing P/E - and what the gap is telling you.
Disclaimer: This article is for educational purposes only and does not constitute investment advice. Always do your own research before making investment decisions.