Fed Projects a Hike: Which Sectors Win and Lose
6/17/2026
The Federal Reserve held rates steady on June 17, 2026, but its new dot plot did something it had not done in years: it penciled in a rate hike. Here is the Fed rate hike sector playbook - which sectors win, which lose, and how to reposition before the next leg.
What Did the Fed Actually Do on June 17?
On the surface, the June 17, 2026 meeting looked like a non-event. The Federal Open Market Committee (FOMC) voted 12-0 to keep the benchmark federal funds rate unchanged at a range of 3.50% to 3.75%, the fourth straight hold. But the story was never the rate. It was the projections.
In the quarterly Summary of Economic Projections, the median official now sees the funds rate ending 2026 at 3.8% - up from 3.4% in the March forecast and a quarter point above the current range. In plain English, the committee's base case shifted from "cut next" to "hike next." Of the 18 policymakers, nine penciled in at least one 25-basis-point increase before year-end, and six projected two.
This was also Chair Kevin Warsh's first meeting at the helm, and he made his skepticism of forward guidance clear by declining to offer a personal rate forecast and announcing task forces to overhaul Fed operations. For the broader context on how Warsh's approach to the dot plot changes the game, see our earlier breakdown of whether Warsh would scrap the Fed dot plot.

The decision at a glance
| Item | June 17, 2026 outcome |
|---|---|
| Federal funds rate | Held at 3.50%-3.75% (4th straight hold) |
| Vote | 12-0, unanimous |
| Median dot, end-2026 | 3.8% (was 3.4% in March) |
| Officials projecting a hike | 9 of 18 (6 see two hikes) |
| Policy bias | Flipped from easing to tightening risk |
Why Did a "Hold" Send Stocks Lower?
Markets do not trade on what the Fed does today. They trade on what the Fed signals about tomorrow. When the dots moved up, traders had to rip up a scenario built around rate cuts and reprice for a hike. The reaction was swift and broad.
- The Dow Jones Industrial Average fell 507 points, or 0.98%.
- The S&P 500 dropped 1.21%.
- The tech-heavy Nasdaq Composite slid 1.34%.
- The rate-sensitive 2-year Treasury yield jumped 16 basis points to 4.21%, its highest in more than a year.
- The U.S. Dollar Index rose about 1%, its best single day in almost a year.
The 2-year yield is the cleanest market proxy for where the funds rate is heading, so its jump is the bond market agreeing with the new dots. Higher front-end yields make every stock's future cash flows worth less today, and they hand savers a risk-free alternative paying north of 4%. That combination is poison for richly valued equities and a tailwind for a select group of sectors. If you are unsure whether this is a normal pullback or the start of something worse, our guide on correction vs bear market lays out the thresholds.
How Higher Rates Reprice Every Sector
Before naming winners and losers, it helps to understand the single mechanism that drives all of it: discounting. A stock is worth the present value of its future cash flows. The math is simple:
Here CF is a future cash flow, t is how many years away it lands, and r is the discount rate, which moves with interest rates. When r rises, the denominator grows, and cash flows that are far in the future shrink the most. That is the entire game.
This is why growth stocks - companies whose biggest profits are expected a decade out - get hit hardest when rates climb. Their value lives in the distant future, and the distant future just got discounted more aggressively. Value stocks that earn cash today are far less sensitive. The same idea explains why forward earnings estimates carry so much weight in a high-rate world, a topic we cover in forward P/E vs trailing P/E.
The second mechanism is competition from bonds. When a 10-year Treasury pays 4.5% risk-free, a utility yielding 3.8% looks worse on a risk-adjusted basis, so income investors rotate out of bond-proxy stocks and into actual bonds. The third is funding cost: capital-intensive and heavily indebted businesses pay more to roll their debt, squeezing margins. Keep these three levers - discounting, bond competition, and funding cost - in mind, and every sector verdict below becomes obvious.
Which Sectors Win When the Fed Turns Hawkish?
Not every stock fears higher rates. A handful of sectors are structurally built to benefit, either because they earn more when rates rise or because their cash flows are near-term and inflation-linked. You can track all of these live on the Finance Halo sector dashboard.
Financials and banks
Banks are the clearest winners. Their core business is to borrow short and lend long, and they profit from the spread between the two, called the net interest margin (NIM):
When the Fed pushes rates up, loan and securities yields often reprice faster than what banks pay depositors, widening the margin. JPMorgan Chase (JPM), Bank of America (BAC), and Wells Fargo (WFC) are the bellwethers here, and the broad Financial Select Sector SPDR (XLF) is the simplest single-ticker expression. The catch: if higher rates choke off loan demand or trigger credit losses, the margin boost can be offset, so quality of the loan book matters.
Energy
Energy is less about rates directly and more about what often causes the Fed to stay hawkish: inflation. Higher oil and gas prices feed the inflation that keeps the Fed tight, and energy producers see revenue rise with the very prices driving policy. That makes the sector a natural inflation hedge. ExxonMobil (XOM) and Chevron (CVX) anchor the group, with the Energy Select Sector SPDR (XLE) as the sector proxy.
Value and quality over speculative growth
Beyond specific sectors, the style winner is value. When rates are high, the market rewards companies generating profits and free cash flow today, including reliable dividend payers, over story stocks promising payoffs years out. Screening for cash-generative, reasonably priced names becomes the edge. You can build exactly that kind of filter on the Finance Halo stock screener by combining a sensible P/E ceiling with positive free cash flow. For the fundamentals behind a value tilt, our deep value stocks beginner guide is a useful primer.
| Winning sector / style | Why it benefits | Example tickers |
|---|---|---|
| Financials | Wider net interest margins as loans reprice | JPM, BAC, WFC, XLF |
| Energy | Inflation-linked revenue; a natural hedge | XOM, CVX, XLE |
| Value & dividend growers | Near-term cash flows discounted less | Quality dividend payers |
Which Sectors Lose When Rates Stay High?
On the other side of the ledger sit the sectors most exposed to discounting and bond competition. These are the names that led the June 17 selloff.
Technology and high-growth
Technology is the textbook loser. The sector's valuation rests on cash flows expected far into the future, exactly the cash flows that higher discount rates punish most. That is why the Nasdaq fell hardest on decision day. It is also why the AI-driven megacaps - NVIDIA (NVDA) and peers - swing so violently on rate news. For more on whether the AI leadership is genuinely wobbling, see is the AI trade cracking. The broad Technology Select Sector SPDR (XLK) captures the group.
Utilities
Utilities are a classic bond proxy. Investors buy them for steady dividends, but when Treasuries yield 4%+, that dividend has to compete with a risk-free alternative and often loses. Worse, utilities run capital-intensive infrastructure funded with heavy debt, so higher financing costs eat into earnings. NextEra Energy (NEE) and the Utilities Select Sector SPDR (XLU) are the names to watch.
Real estate and REITs
Real estate investment trusts (REITs) get hit twice. First, they borrow heavily to acquire and develop property, so rising rates lift their cost of capital. Second, like utilities, their dividends must compete with bond yields, pressuring valuations. Higher mortgage rates also cool property demand. Realty Income (O) and the Real Estate Select Sector SPDR (XLRE) are widely held proxies.
| Losing sector | Why it suffers | Example tickers |
|---|---|---|
| Technology / growth | Distant cash flows discounted harder | NVDA, XLK |
| Utilities | Bond proxy + high debt financing costs | NEE, XLU |
| Real estate (REITs) | Heavy borrowing + yield competition | O, XLRE |
The Live Scoreboard: Finance Halo's Sector Heatmap
Theory is one thing; the tape is another. The most useful confirmation that this framework works is to watch how sectors actually behaved on decision day. The Finance Halo sector performance heatmap told the story in real time.
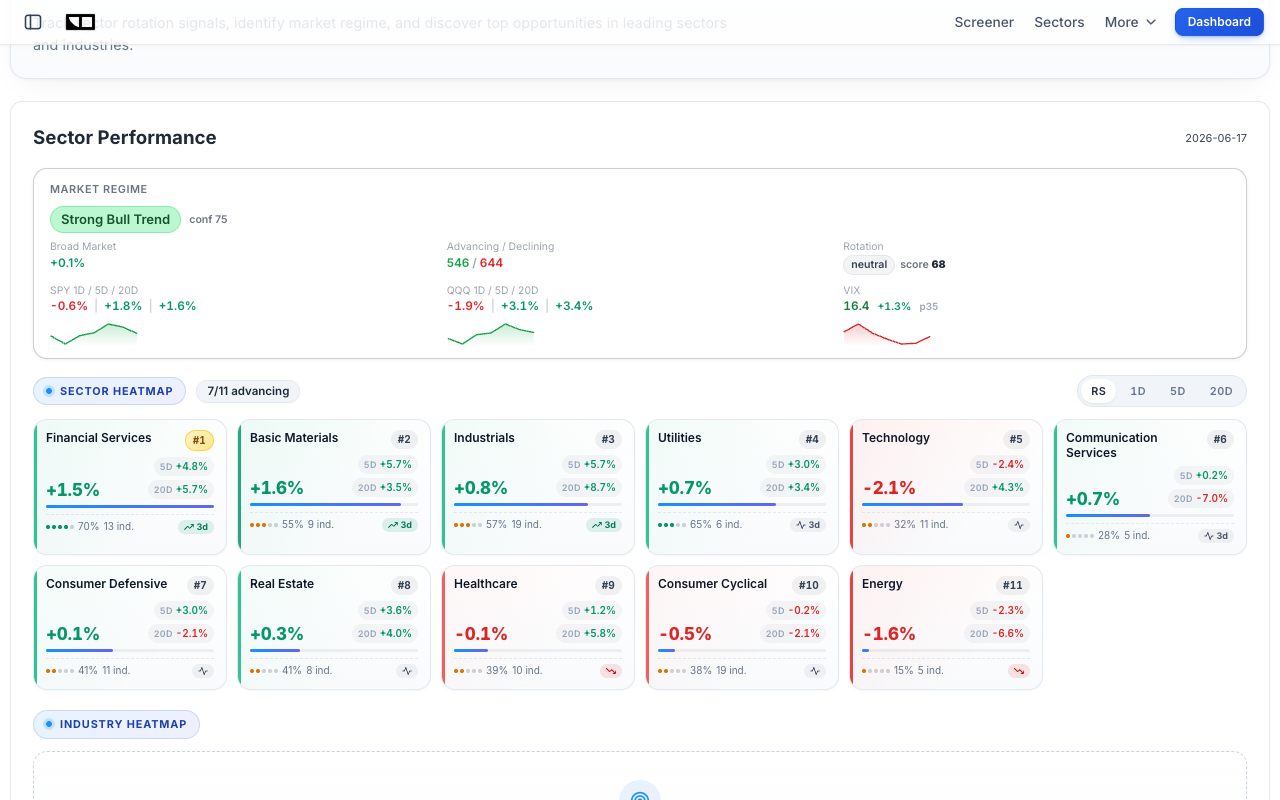
The ranking was almost a caricature of the rate-hike playbook. Financial Services led at #1 with a +1.5% gain, joined near the top by Basic Materials and Industrials. Technology sat at the very bottom, down 2.1%, the clear laggard. Even the regime read - a "Strong Bull Trend" with the VIX near 16.4 - showed the rotation was orderly, not panic. Money was not fleeing the market; it was rotating from rate losers to rate winners.
You can also drop the same live data straight into your own site. The embeddable version below updates continuously:
The 2022 Playbook: What History Tells Us
If a hawkish Fed and a sector rotation feel familiar, that is because we lived through an extreme version in 2022. That year the Fed raised rates at the fastest pace in four decades, and the sector dispersion was historic.
- Energy was the runaway winner. It was by far the best-performing S&P 500 sector for the full year, lifted by surging oil and gas prices.
- Technology was the worst. The Nasdaq fell 32.5%, its worst year since 2008, as higher rates crushed long-duration growth valuations.
- Breadth collapsed. Only two of the 11 S&P 500 sectors ended 2022 with gains.
The lesson is not that 2026 will rerun 2022 - the Fed is nudging, not slamming, the brakes this time. The lesson is about direction: when the policy bias tilts hawkish, money consistently rotates toward financials and energy and away from high-multiple tech and bond proxies. History also adds nuance. According to Charles Schwab research, six of the 11 sectors have historically outperformed the broad market in the 12 months after an initial rate increase, including, perhaps surprisingly, information technology and health care. The takeaway: rotation is real, but it is not a license to abandon a whole sector. For a deeper look at reading these macro regimes, the inverted yield curve guide pairs well here.
Real-World Example: JPMorgan vs a High-Multiple Tech Name
To make the winner-loser split concrete, contrast two real companies on opposite sides of the rate trade: JPMorgan Chase (JPM), the largest U.S. bank, and a high-multiple growth name like NVIDIA (NVDA).
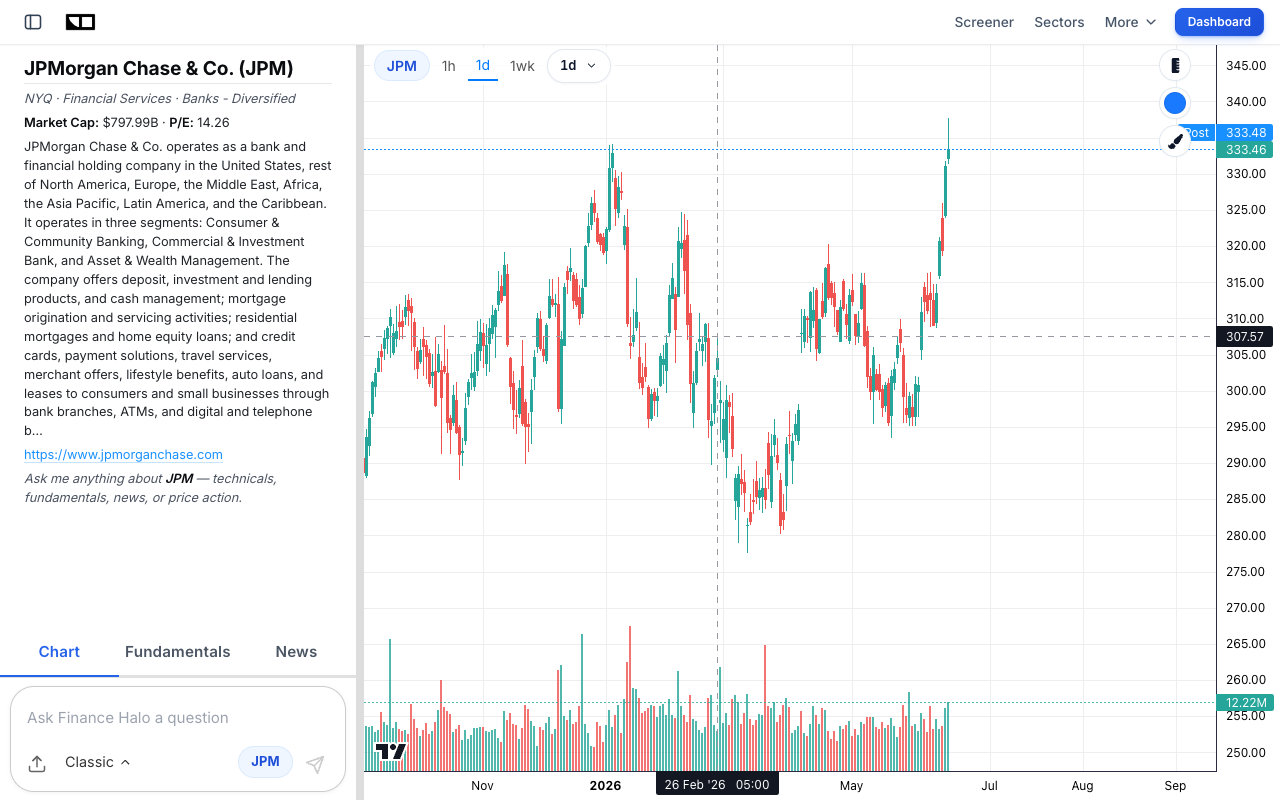
JPMorgan trades at a trailing P/E of roughly 14, earns enormous profits today, and sees its net interest income rise as rates climb. Its valuation barely flinches when the discount rate moves a few tenths of a percent, because so little of its value sits in the distant future. The chart shows it breaking out toward $333 even as the broad market wobbled.
A high-multiple growth stock is the mirror image. When much of the value is parked in cash flows expected in 2030 and beyond, a rising discount rate compresses the multiple immediately, which is exactly why the Nasdaq led the June 17 decline. The point is not that one is "good" and the other "bad" - it is that they sit at opposite ends of duration, and a hawkish Fed rewards the short end. You can run this exact comparison yourself by analyzing each ticker with Finance Halo's AI assistant and asking how rate changes flow through to each model.
How to Reposition for "Higher for Longer"
Knowing the winners and losers is only useful if you act on it without over-trading. Here is a disciplined, step-by-step approach.
- Audit your duration. Add up how much of your equity exposure sits in long-duration growth (unprofitable tech, speculative names). If it dominates, you are heavily exposed to the discount-rate lever.
- Add a quality tilt, not a gamble. Shift marginal dollars toward profitable, cash-generative companies. Use the screener to filter for a reasonable P/E and positive free cash flow rather than chasing the hottest story.
- Right-size your bond proxies. You do not have to dump every utility or REIT, but if you own them purely for yield, ask whether a 4%+ Treasury does the job with less risk.
- Let dividends grow, not just sit. In a rising-rate world, dividend growth beats a static high yield, because a growing payout offsets the rising competition from bonds.
- Watch the regime daily. Use the Market Intelligence Dashboard and sector heatmap to confirm the rotation is intact before adding to winners.
- Keep dry powder. Hawkish surprises create volatility, and volatility creates entry points. Cash yields more than it has in years, so waiting is no longer free of opportunity cost - it pays.
If your bigger worry is the macro backdrop turning into something stickier, our guide on what stagflation means for your portfolio covers the assets that hold up when growth slows but inflation will not quit.
Common Mistakes to Avoid
- Trading the headline, not the signal. The Fed "held" rates, yet stocks fell. Reacting to the word "hold" instead of the hawkish dots would have left you confused. Read the projections, not just the decision.
- Treating a whole sector as untouchable. "Tech always falls when rates rise" is too blunt. Profitable, cash-rich tech behaves very differently from speculative, money-losing tech. Duration, not the sector label, is what matters.
- Chasing yield into a trap. A high dividend yield on a utility or REIT can be a warning, not a gift, when bond yields are climbing. Prioritize payout safety and growth over headline yield.
- Ignoring the loan book in bank stocks. Wider margins help banks only if credit quality holds. A hawkish Fed that triggers a recession can turn the margin tailwind into a credit headwind.
- Over-trading the rotation. Whipsawing your whole portfolio on a single meeting racks up taxes and costs. Adjust at the margin and let the trend confirm itself.
- Forgetting the dollar. A 1% dollar surge is a headwind for U.S. multinationals and commodity prices. Sector calls that ignore the currency move are only half the picture.
Frequently Asked Questions
Did the Fed actually raise rates on June 17, 2026?
No. The Fed left the federal funds rate unchanged at 3.50%-3.75% for the fourth straight meeting. What changed was the dot plot: the median projection now shows a rate hike before the end of 2026, with nine of 18 officials penciling in at least one increase.
Which sectors benefit most from a Fed rate hike?
Financials, especially banks, are the primary beneficiaries because higher rates widen their net interest margins. Energy often benefits too, since the inflation that keeps the Fed hawkish also lifts oil and gas revenue. More broadly, value and dividend-growth stocks outperform speculative growth.
Why do technology stocks fall when interest rates rise?
Technology and growth companies derive most of their value from cash flows expected years in the future. A higher discount rate shrinks the present value of those distant cash flows more than it does for companies earning profits today, so high-multiple tech valuations compress fastest.
Are utilities and REITs bad investments when rates are high?
They face real headwinds. Both are "bond proxies" whose dividends must compete with rising Treasury yields, and both carry heavy debt that gets costlier to refinance. They are not automatically bad, but if you own them purely for income, a 4%+ Treasury may offer similar yield with less risk.
Why did the stock market fall if the Fed didn't hike?
Markets price the future, not the present. When the Fed signaled that hikes are now its base case, investors had to abandon a rate-cut scenario and reprice for tighter policy. The 2-year Treasury yield jumped to 4.21% and the dollar surged, both of which pressure equity valuations.
How can I tell which sectors are leading right now?
Use a live sector tracker. The Finance Halo sector heatmap ranks all 11 S&P sectors by performance with a risk-on/risk-off regime signal, so you can confirm a rotation is real before acting on it.
Does "higher for longer" mean a recession is coming?
Not necessarily. Higher-for-longer means rates stay elevated to fight inflation, which slows growth but does not guarantee a contraction. Watch the yield curve and credit spreads for recession warnings rather than the rate level alone.
Conclusion
The June 17, 2026 meeting was a reminder that the Fed's signal matters more than its action. By holding rates but projecting a hike, the committee flipped the market's assumptions and triggered a clean sector rotation: money flowed toward financials and energy, the rate winners, and away from technology, utilities, and REITs, the rate losers. The mechanism is timeless - higher discount rates punish distant cash flows and hand bonds a competitive edge - and the live tape confirmed it, with Financials ranked #1 and Technology last on decision day.
For investors, the playbook is not to panic or to chase. It is to understand duration, tilt toward quality and cash flow, right-size the bond proxies, and let the daily regime read confirm the trend. A Fed rate hike does not have to be a threat to your portfolio. Positioned correctly, it can be an opportunity.
Try it yourself: Analyze JPMorgan (JPM) with Finance Halo's AI assistant to see how higher rates flow through to bank earnings, then compare it against any tech name in seconds.
Disclaimer: This article is for educational purposes only and does not constitute investment advice. Always do your own research before making investment decisions.