What Is Stagflation? An Investor's 2026 Guide
6/9/2026
Stagflation is the rare, painful mix of high inflation, stagnant economic growth, and rising unemployment that breaks the normal market playbook. With 2026 CPI running at 3.8% and growth cooling, here is what stagflation means for your portfolio and how to prepare.
What Is Stagflation?
Stagflation is an economy that suffers from high inflation and weak growth at the same time, usually alongside rising unemployment. The word is a portmanteau of "stagnation" and "inflation," popularized and probably coined by British politician Iain Macleod in 1965. It describes a situation that standard economic models long treated as a contradiction.
For most of the postwar era, economists assumed inflation and unemployment moved in opposite directions, a relationship captured by the Phillips Curve. When the economy ran hot, prices rose but jobs were plentiful; when it cooled, prices fell along with employment. Stagflation shattered that assumption by delivering the worst of both worlds: your cost of living climbs while your job security and investment returns shrink.
That is exactly why stagflation is so dangerous for investors. The usual hedges cancel out. Cash loses purchasing power to inflation, while stocks and bonds struggle under slowing growth and rising interest rates. Understanding the dynamic is the first step to protecting a portfolio, and it starts with the three core ingredients.
The Three Ingredients of Stagflation
True stagflation requires three conditions to appear together. Any one of them on its own is a normal part of the business cycle. It is the combination that creates the policy trap.
1. High and Persistent Inflation
Prices rise faster than wages, eroding real income. Critically, the inflation is persistent rather than a one-off spike. In the 1970s, U.S. inflation stayed above 6% for most of the decade, peaking near 11% in 1974 and roughly 13.5% in 1980.
2. Stagnant or Falling Economic Growth
Gross domestic product flatlines or contracts. Businesses stop expanding, capital investment dries up, and corporate earnings stall. Unlike a clean recession, growth does not weaken enough to drag inflation down with it.
3. Elevated Unemployment
As output stalls, companies cut hiring and lay off workers, pushing the jobless rate higher even as prices keep climbing. Economists track the pain with the Misery Index, which simply adds the two together:
A reading above 10% is uncomfortable. The Misery Index peaked at 21.98% in June 1980, the highest in modern U.S. history, capturing just how brutal that era felt for ordinary households.
What Causes Stagflation?
Stagflation does not appear out of nowhere. It is usually the product of a supply-side shock colliding with loose monetary or fiscal policy. There are two classic drivers.
Supply Shocks
A sudden disruption to a critical input, most often energy, raises production costs across the entire economy. Higher input costs push prices up (inflation) while simultaneously choking output (stagnation). The 1973 OPEC oil embargo, which quadrupled crude prices, is the canonical example. A modern energy spike driven by geopolitical conflict works the same way.
Policy Mistakes
When a central bank keeps interest rates too low for too long, or governments run large deficits while the economy is supply-constrained, they pour fuel on inflation without fixing the growth problem. The 1970s Federal Reserve was slow to tighten, allowing inflation expectations to become entrenched. You can read the Federal Reserve's own history of the Great Inflation for a detailed account of those policy errors.
The cruel irony is that the cure can be as painful as the disease. To kill inflation, a central bank must raise rates aggressively, which deliberately slows growth and raises unemployment in the short term, exactly what stagflation already does.
The 1970s: Stagflation's Defining Decade
The 1970s remain the reference point for every stagflation discussion, and for good reason. Two oil shocks, the 1973 OPEC embargo and the 1979 disruption following the Iranian Revolution, sent energy prices soaring. Crude oil leapt from around 3 dollars per barrel to roughly 40 dollars over the decade.
The damage to investors was severe but easy to miss if you only look at headline numbers. The S&P 500 posted a nominal compound annual growth rate of about 5.9% during the 1970s, which sounds positive. But with inflation averaging roughly 7% per year, the real, inflation-adjusted return was actually negative. Measured from the 1966 peak through 1979, the index lost more than 18% of its purchasing power, a real loss of about 1.5% annually for over a decade.

The era only ended when Federal Reserve Chair Paul Volcker took the painful path. Starting in 1979, he pushed the federal funds rate toward nearly 20%, triggering back-to-back recessions but ultimately crushing inflation from 13.5% to below 4% by the mid-1980s. That reset launched one of the greatest bull markets in history, with the S&P 500 compounding at roughly 17.6% per year through the 1980s.
Stagflation vs. Recession vs. Inflation
Investors often confuse these three states because they overlap. The distinction matters because each calls for a different defensive playbook. A garden-variety recession actually brings inflation down, which is why bonds usually rally in a downturn. Stagflation removes that cushion.
| Condition | Inflation | Growth | Unemployment | Bonds Typically |
|---|---|---|---|---|
| Normal expansion | Moderate | Rising | Falling | Stable |
| Standard recession | Falling | Falling | Rising | Rally (safe haven) |
| High inflation boom | High | Rising | Falling | Fall (rates rise) |
| Stagflation | High | Stagnant/Falling | Rising | Fall (worst case) |
The bottom row is the problem. In stagflation, the traditional 60/40 stock-and-bond portfolio fails on both sides: stocks struggle with weak earnings and bonds get hammered by rising rates. If you want a refresher on how deep market declines are classified, see our guide on the difference between a correction and a bear market.
Are We Heading Into Stagflation in 2026?
This is the question on every investor's mind in mid-2026, and the data is genuinely mixed. The inflation side of the equation has clearly reawakened. Recent readings show the warning lights flashing.
- Headline CPI: Up 3.8% year over year in April 2026, the highest since 2023 and well above the Fed's 2% target.
- Producer prices (PPI): Jumped to 6% year over year, the hottest since December 2022, signaling more pipeline inflation to come.
- Energy: The primary culprit, with energy prices up 17.9% year over year and gasoline up 28.4% as geopolitical conflict squeezed supply, a direct echo of the 1970s oil shocks.
- Core CPI: Holding at 2.8%, showing inflation is broadening beyond just energy.
The growth side is where it gets nuanced. So far the economy has proven resilient to the price shock, and the labor market has not cracked. The average economist still puts the odds of an outright recession in the next year at only about 33%, according to a Wall Street Journal survey. But markets are taking the threat seriously: traders now price roughly a 40% probability of stagflation taking hold by late 2026.
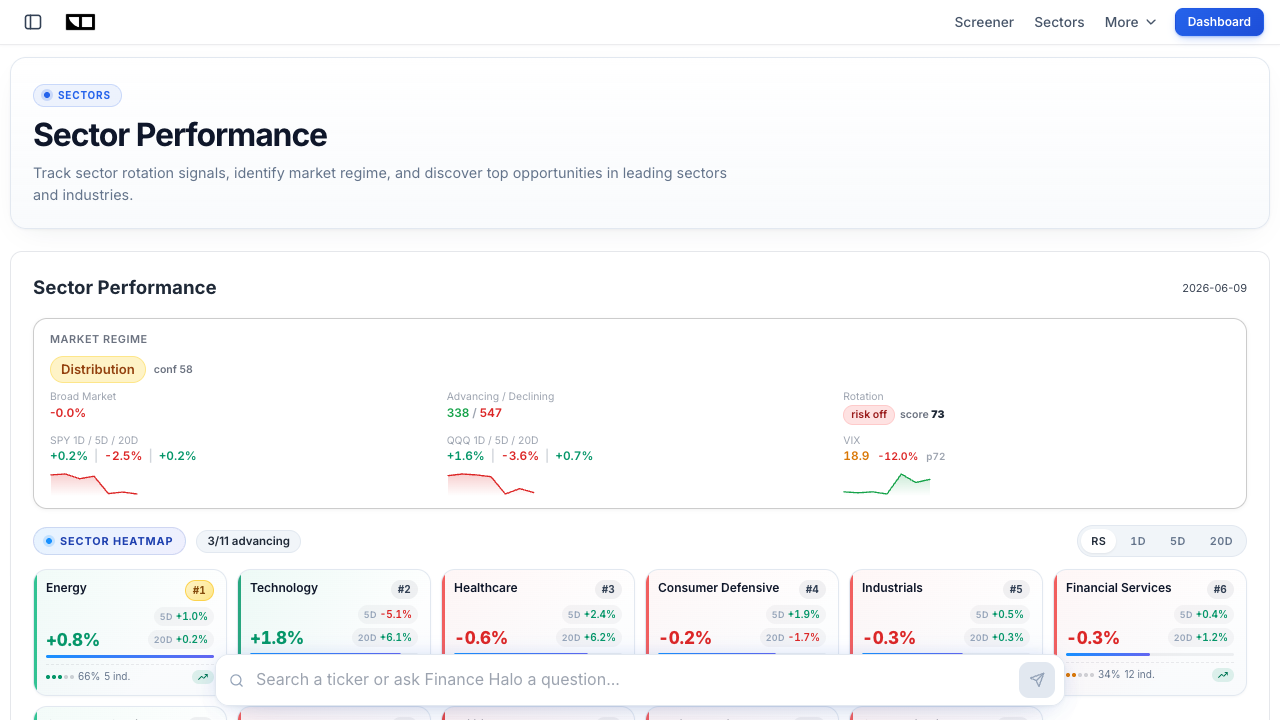
The wild card is the Federal Reserve. New Chair Kevin Warsh inherits a benchmark rate of 3.50% to 3.75% and an inflation problem that will not quit. Markets increasingly expect the Fed to drop its easing bias and even consider rate hikes, a hawkish pivot that would protect the currency but risk tipping growth into the "stag" half of stagflation. You can track the macro setup and sentiment in real time on the Finance Halo Market Intelligence Dashboard.
How Stagflation Hurts a Standard Portfolio
The reason stagflation terrifies investors is that it attacks both halves of a conventional portfolio simultaneously. Here is the mechanism.
Why Growth Stocks Suffer Most
A stock's value is the present value of its future cash flows. When inflation forces interest rates higher, the discount rate applied to those far-off cash flows rises, which compresses valuations. High-multiple growth stocks, whose value sits mostly in distant future profits, get hit hardest. This is the same valuation-compression dynamic we explain in our guide on what counts as a good P/E ratio. Expensive stocks have the most multiple to lose.
Why Long Bonds Suffer Too
Bonds normally cushion a stock decline. In stagflation they do the opposite. Rising inflation erodes the fixed coupon's real value, and as rates climb, existing bond prices fall. A 30-year Treasury can lose serious principal value in a rising-rate environment, removing the diversification investors count on.
Why Cash Is Not Safe Either
Holding cash feels defensive, but with inflation at 3.8% or higher, money sitting in a low-yield account loses purchasing power every single month. The lesson of stagflation is that doing nothing is itself a losing strategy. You must actively position toward assets that can outrun rising prices.
Which Assets Perform Best During Stagflation?
History offers a remarkably consistent playbook. During the 1970s, the assets that thrived shared one trait: they were tied to real, physical value or rising prices rather than to discounted future cash flows. Here is what actually worked.
| Asset Class | 1970s Performance | Why It Worked |
|---|---|---|
| Gold | ~2,200% (from 35 to over 800 per ounce) | Classic inflation hedge and store of value |
| Commodities (broad) | S&P GSCI +586% (1970-79) | Prices rise directly with inflation |
| Energy stocks | Best-performing sector by far | Oil producers profit from the shock itself |
| REITs / Real estate | ~100% total return (1971-81) | Hard assets and rents reprice with inflation |
| Value stocks | Outperformed growth | Lower multiples mean less to compress |
Gold and Commodities
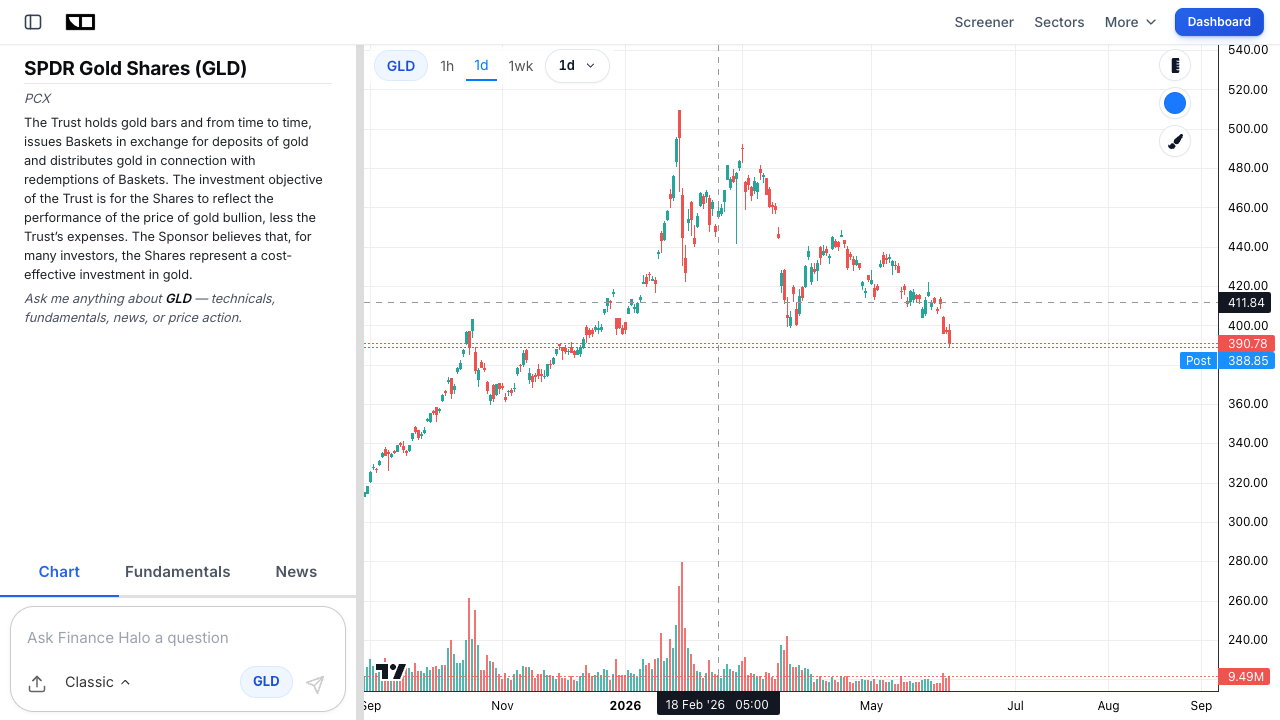
Gold was the single best-performing asset class of the decade, climbing from a fixed 35 dollars per ounce to over 800 dollars. Broad commodities, tracked by the S&P GSCI index, returned a staggering 586% between 1970 and 1979. You can watch gold's modern trend through an ETF like SPDR Gold Shares.
Energy Stocks
If a supply shock is causing the inflation, the companies selling that supply are the obvious winners. In the 1970s, while the S&P fell about 50% in real terms, major oil companies saw profits double. Integrated giants like Exxon Mobil (XOM) and Chevron (CVX) are the modern equivalents that tend to benefit directly from an energy-driven inflation spike.
Value Over Growth
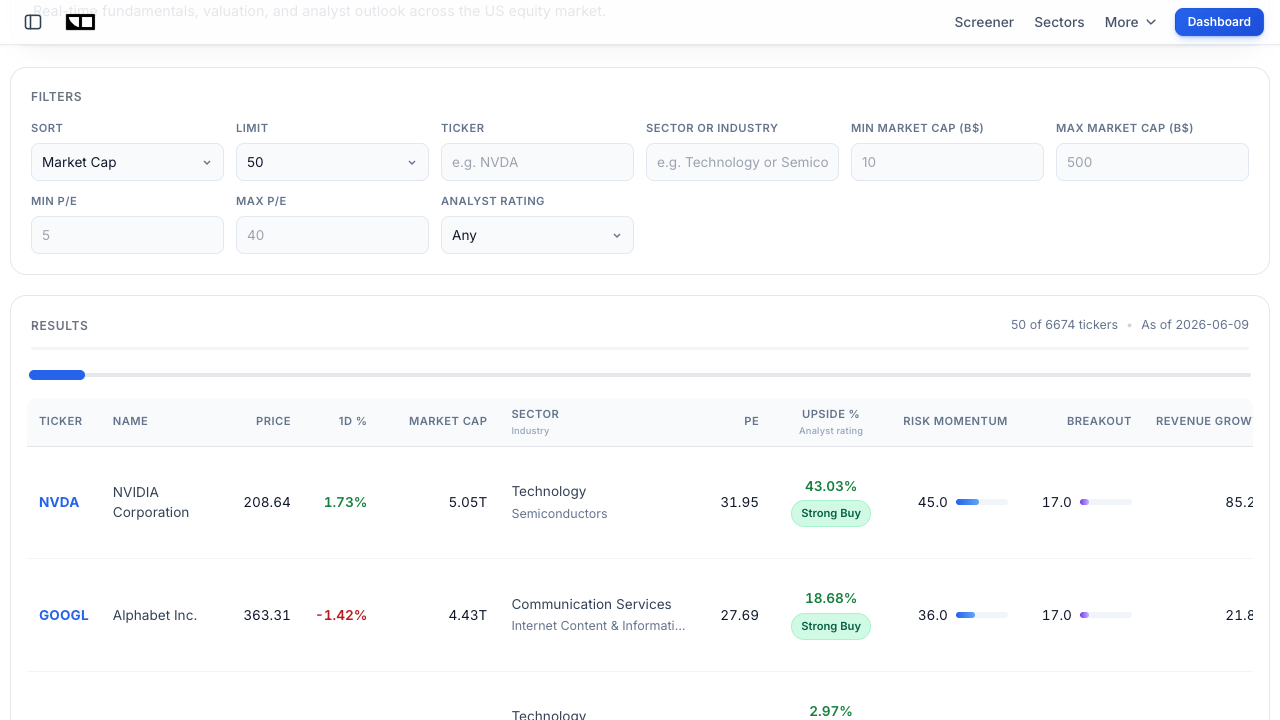
Cheap, profitable, dividend-paying companies, the kind found by screening for low valuations, historically held up far better than speculative growth names. Our beginner's guide to deep value stocks walks through how to find them, and you can rank candidates directly on the stock scores screener using the Deep Value factor.
How to Build a Stagflation-Resistant Portfolio
You do not need to overhaul everything overnight. A few deliberate tilts can dramatically improve resilience. Here is a practical, step-by-step framework.
- Add a real-asset sleeve. Allocate a slice of the portfolio (often 5% to 15%) to gold, broad commodities, or real estate (REITs). These are your direct inflation hedges.
- Tilt equities toward value and quality. Favor profitable companies with pricing power, low debt, and reasonable valuations over speculative high-multiple growth. Use the market screener to filter by P/E range and sector.
- Overweight defensive and energy sectors. Energy benefits from the shock, while consumer staples, utilities, and healthcare offer steady demand. Check the sector rotation page to see which groups are leading right now.
- Shorten bond duration. Swap long-dated bonds for short-term Treasuries, T-bills, or TIPS (Treasury Inflation-Protected Securities), which reset with inflation and carry far less interest-rate risk.
- Keep contributing systematically. Volatility is brutal in stagflation, so do not try to time the bottom. A disciplined approach like dollar-cost averaging keeps you buying through the turbulence.
Before buying anything, run it through a proper checklist. Our guide on how to analyze a stock before buying covers the fundamentals that matter most when growth is scarce and quality commands a premium.
Case Study: The 1973-1982 Stagflation Portfolio
To make this concrete, imagine two investors at the start of 1973, each with 10,000 dollars, just before the oil embargo hit.
Investor A holds a traditional portfolio: 100% in the S&P 500. Over the next several years, this investor watches the index fall about 50% in real terms during the 1973-74 bear market and spends the rest of the decade simply trying to recover purchasing power. By 1979, the nominal account value has barely grown, and after roughly 7% annual inflation, the real wealth has actually shrunk by double digits.
Investor B builds a stagflation-aware mix: 40% value and energy stocks, 20% gold, 20% broad commodities, and 20% short-term bonds. The gold sleeve alone multiplies many times over as bullion runs from 35 to over 800 dollars. The energy stocks profit from the very oil shock crushing the broad market, and the commodity basket compounds with the S&P GSCI's 586% gain. While Investor A treads water, Investor B not only protects purchasing power but grows real wealth through the decade.
The lesson is not that you should abandon stocks. It is that asset-class diversification into real assets is the difference between surviving and thriving when inflation and stagnation strike together. The same diversification logic that powers index investing, explored in our MSCI World vs. S&P 500 comparison, extends beyond equities into commodities and hard assets during a stagflation regime.
Common Mistakes to Avoid
- Hiding entirely in cash. It feels safe, but inflation quietly destroys its purchasing power. Cash is a wasting asset in a 3.8% inflation world. The fix: hold real assets and short-term inflation-linked bonds instead of idle cash.
- Buying long-duration bonds for "safety." Long Treasuries that rally in a normal recession get crushed by rising rates in stagflation. The fix: shorten duration or use TIPS.
- Chasing expensive growth stocks. High-multiple names face the steepest valuation compression when rates rise. The fix: rotate toward quality value with real earnings.
- Trying to time the exact bottom. Stagflation markets are choppy and can grind for years. The fix: invest systematically rather than waiting for an all-clear that may never ring.
- Ignoring sector positioning. Owning a market-cap index leaves you overweight the sectors that suffer most. The fix: deliberately overweight energy and defensives using the sector page.
- Assuming the 1970s will repeat exactly. History rhymes, it does not photocopy. The fix: use the historical playbook as a guide while watching live data like CPI, PPI, and Fed policy.
Frequently Asked Questions
What is stagflation in simple terms?
Stagflation is when an economy has high inflation (prices rising fast), stagnant growth (the economy barely expanding or shrinking), and rising unemployment all at once. It is painful because the usual fixes for one problem tend to make the others worse.
What causes stagflation?
The two main causes are a supply shock, most often a sharp spike in energy prices that raises costs while choking output, and policy mistakes, such as a central bank keeping interest rates too low for too long. The 1970s combined both: oil embargoes plus slow Fed tightening.
Is the U.S. in stagflation in 2026?
Not officially, but the risk is real. As of mid-2026, CPI is running at 3.8% and PPI at 6%, both well above target, driven largely by an energy shock. Growth has held up so far, so it is not full stagflation yet, but markets price roughly a 40% chance it takes hold by late 2026.
What is the best investment during stagflation?
Historically, gold was the single best performer, rising about 2,200% in the 1970s. Broad commodities, energy stocks, real estate (REITs), and cheap value stocks also outperformed. The common thread is real, physical assets that reprice with inflation rather than assets valued on distant future cash flows.
How is stagflation different from a recession?
In a normal recession, inflation falls along with growth, so bonds usually rally and act as a safe haven. In stagflation, inflation stays high while growth stalls, so both stocks and bonds can fall together, removing the cushion a standard 60/40 portfolio relies on.
Do bonds do well in stagflation?
Generally no, especially long-duration bonds. Rising inflation erodes the real value of fixed coupons, and rising interest rates push existing bond prices down. Short-term Treasuries and TIPS (inflation-protected bonds) hold up far better than long-dated debt.
How long does stagflation last?
It can last for years if left unchecked. The 1970s stagflation persisted for roughly a decade and only ended when Fed Chair Paul Volcker raised rates toward 20%, triggering a sharp recession that finally broke inflation by the mid-1980s.
Conclusion
Stagflation is the economic scenario investors fear most because it disarms the standard playbook: cash erodes, long bonds fall, and high-multiple growth stocks get repriced lower, all at once. The 1970s showed how punishing it can be, with the S&P 500 delivering a negative real return for an entire decade and the Misery Index peaking near 22%.
But that same history hands you a clear blueprint. Real assets like gold and commodities, energy producers, quality value stocks, and short-duration bonds were the survivors and the winners. With 2026 inflation running at 3.8%, energy prices spiking, and markets pricing a 40% stagflation probability, the prudent move is not panic, it is preparation. Tilt toward real assets and resilient value names, shorten your bond duration, stay diversified across asset classes, and keep investing systematically through the volatility. The investors who study the stagflation playbook now will be the ones positioned to protect and grow their wealth if it arrives.
Try it yourself: Use Finance Halo's AI assistant to get instant analysis on any stock, ETF, or commodity. Just type a ticker and ask how it tends to perform when inflation runs hot.
Disclaimer: This article is for educational purposes only and does not constitute investment advice. Always do your own research before making investment decisions.