Correction vs Bear Market: What's the Difference?
6/8/2026
A correction vs bear market debate flares up every time stocks tumble, but the two are not the same thing. One is a routine speed bump, the other a genuine regime change. Knowing which is which changes how you should act with your money.

Correction vs Bear Market: The Core Difference
The difference between a correction and a bear market comes down to a single number: the size of the decline from the most recent high. A correction is a fall of more than 10% but less than 20% from a recent peak. A bear market is a peak-to-trough decline of 20% or more, measured on a closing basis. Anything smaller than 10% is just a pullback or a dip.
These thresholds are conventions, not laws of physics, but the whole financial industry uses them, so they shape how analysts, fund managers, and the financial media talk about a selloff. When the S&P 500 closes 20% below its prior high, headlines flip from "correction" to "bear market" overnight, even if the underlying economy has not changed at all.
The deeper distinction is psychological. A correction is usually a reset of valuations after prices ran too hot. A bear market, by contrast, reflects a broader crisis of confidence about the future - earnings, the economy, or the financial system itself. As Morningstar puts it, a bear market signals a far greater erosion of investor faith than a correction does.
Why the 10% and 20% lines matter
Round numbers become self-fulfilling. As the market approaches a 10% drop, financial outlets start running "correction watch" stories, which can accelerate selling. The same happens at the 20% bear-market line. Understanding that these are sentiment triggers - not signals that something fundamental just broke - helps you avoid reacting to a label instead of to the facts.
Pullback, Correction, Bear Market, Crash: The Full Spectrum
"Correction" and "bear market" are only two points on a spectrum of declines. To put the two head-to-head, it helps to see the full ladder of market drops, from the everyday wobble to the rare collapse.
| Type of decline | Size (from peak) | Typical frequency | What it usually signals |
|---|---|---|---|
| Pullback / dip | 5% to 10% | Several times a year | Normal noise, profit-taking |
| Correction | 10% to 20% | ~Once every 19 months | Valuation reset inside an uptrend |
| Bear market | 20% or more | ~Every 3.5 years | Crisis of confidence; often recession-linked |
| Crash | Sharp 20%+ in days | Rare | Panic, forced selling, liquidity shock |
A few important notes on this ladder:
- A crash is not a separate category by size - it is a bear market (or the start of one) that happens with brutal speed. The 2020 COVID drop is the classic modern example.
- The boundaries overlap. A correction can keep falling and become a bear market. The label only updates once a new threshold is crossed.
- These figures are about broad indexes like the S&P 500. Individual stocks routinely fall 20% on a single bad earnings report without any index entering a bear market.
How Often Do Corrections and Bear Markets Happen?
Corrections feel scary in the moment, but the data shows they are a normal, recurring feature of investing. According to data going back to 1928, the S&P 500 has experienced a decline of 10% or more in 61 of 96 years - about 64% of the time. In other words, there is a better-than-6-in-10 chance the index falls at least 10% at some point in any given year.
Smaller pullbacks are even more common. Since 1980, declines of 5% or more have occurred an average of 4.6 times per year, according to Charles Schwab. Meaningful dips, in other words, are the price of admission for long-term returns.
The frequency gap between corrections and bear markets
Bear markets are a different animal. They arrive far less often - roughly once every 3.5 years on average - and there have been 27 of them in the S&P 500 since 1928. Crucially, over that same span there have been 28 bull markets, and stocks have risen enormously over the long run. The bear markets are the dramatic interruptions; the bull markets are the main story.
| Metric | Correction (10-20%) | Bear market (20%+) |
|---|---|---|
| Average frequency | ~Once every 19 months | ~Once every 3.5 years |
| Years with this drop (since 1928) | ~64% of years | Far fewer |
| Average duration | 3 to 4 months | ~9.6 months (289 days) |
| Average decline | ~13% to 15% | ~33% (post-1937 average) |
The takeaway: if you invest for any meaningful length of time, you will live through many corrections and several bear markets. Planning for them in advance beats reacting in panic. A simple framework for staying invested through the noise is dollar-cost averaging versus lump-sum investing, which we break down in detail.
How Long Do They Last and How Deep Do They Go?
Duration and depth are where the correction vs bear market gap becomes most visible. Corrections are typically short and shallow, lasting an average of three to four months. Bear markets last an average of 9.6 months and, excluding the Great Depression, decline roughly 33% on average from peak to trough.
Recovery time is the part investors underestimate. The average bear-market recovery - from the trough back to a new all-time high - is about 50 months, though the median is far shorter at around 14 months because a handful of secular collapses (1929, 1937, 1973, 2000) drag the average up. Strip those four out and the typical recovery is closer to 16 months.
A century of bear markets at a glance
Not all bear markets are equal. The table below shows how dramatically depth and duration can vary, using four of the most-studied declines plus the fastest bear market on record.
| Bear market | Peak-to-trough decline | Duration | Notes |
|---|---|---|---|
| 1929-1932 (Great Depression) | -86.2% | ~3 years | ~25 years to fully recover |
| Dot-com (2000-2002) | -49% | ~685 days | Longest of the modern era |
| Financial crisis (2007-2009) | ~-48% to -57% | ~407 days | Systemic banking shock |
| 2022 | -25.4% | ~282 days | Shallowest of the four |
| COVID (2020) | -33.9% | 33 days | Fastest bear market ever |
The contrast between 2020 and 1929 makes the point: a bear market can be over in a month or take a generation to recover from. The label "bear market" tells you the size of the drop, not how long you will have to wait to get back to even.
Why Do Most Corrections Never Become Bear Markets?
Here is the statistic every nervous investor should memorize: going back to 1975, only 6 of 27 corrections deepened into a full bear market. That means roughly 78% of the time, a 10% drop stopped, reversed, and the market moved on without ever crossing the 20% line.
Why? Most corrections are driven by sentiment and positioning rather than a broken economy. When prices fall 10% to 15%, valuations cool, bargain hunters step in, and the selloff exhausts itself. A correction only metastasizes into a bear market when something structural deteriorates underneath it.
The usual ingredients that turn a correction into a bear market include:
- A recession - falling earnings and rising unemployment justify a deeper repricing.
- A credit or banking shock - as in 2008, when the financial plumbing itself froze.
- Aggressive monetary tightening - sharply rising interest rates, as in 2022, compress valuations across every asset.
- A burst valuation bubble - as in 2000, when richly priced themes unwound.
If none of those conditions are present, the base-rate odds strongly favor the correction being a buying opportunity rather than the start of something worse. That is why understanding the macro backdrop matters so much - and why Finance Halo's AI-generated market intelligence dashboard focuses on the regime, sentiment, and sector setup rather than the daily price move alone.
Is June 2026 a Correction or Just a Rotation?
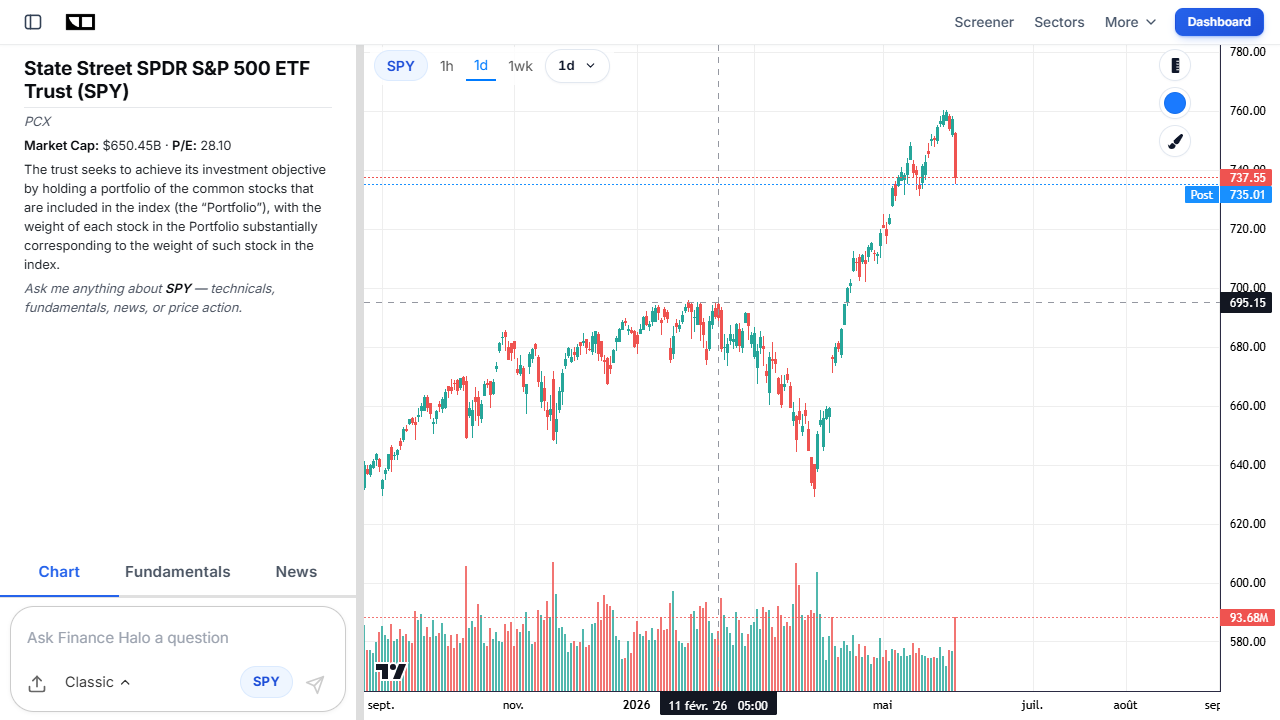
The current selloff is a perfect live case study. On June 5, 2026, the tech-heavy Nasdaq Composite fell 4.18% to close at 25,709.43 - its worst single day since April 2025 - as a violent slide in semiconductor stocks wiped roughly $1 trillion off the market. The S&P 500 dropped 2.64% to 7,383.74 and the Dow lost 695 points.
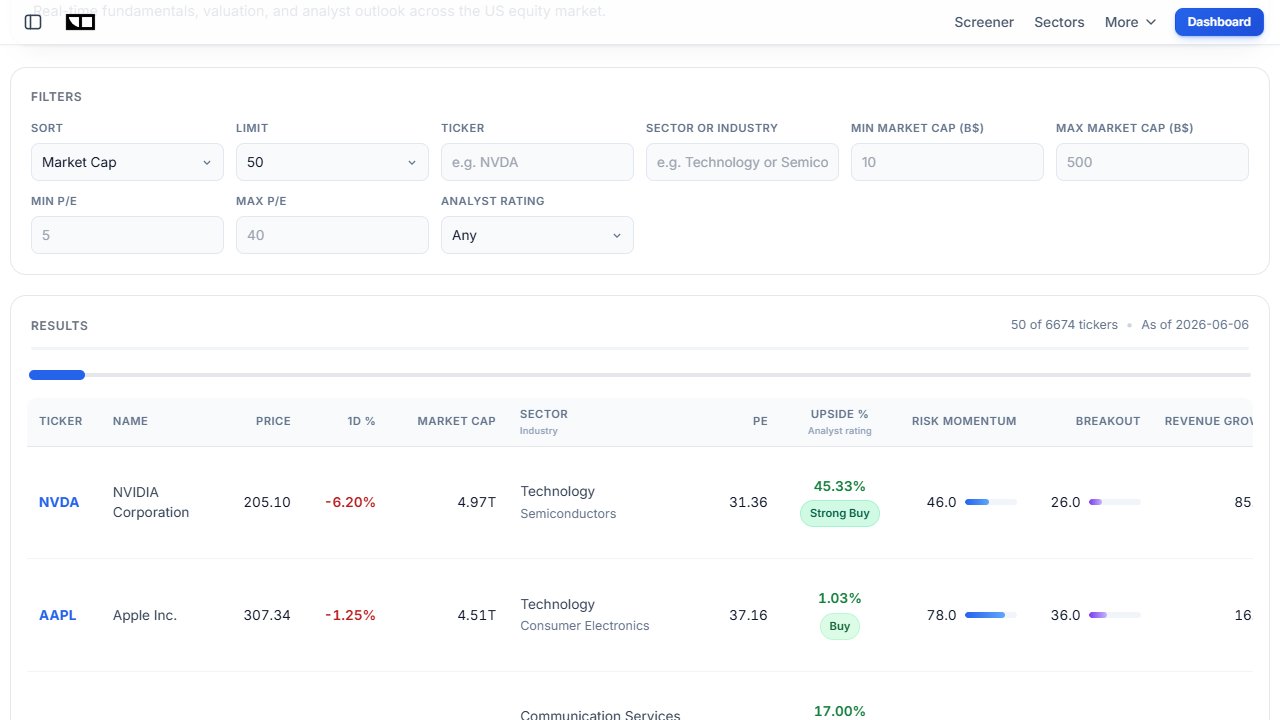
The trigger was twofold. First, Broadcom (AVGO) reported strong results but failed to raise its AI chip outlook, sparking a "sell-the-news" reaction that dragged the whole chip complex lower. Micron (MU) fell about 17% over two days, NVIDIA (NVDA) slid, and AMD dropped sharply. Second, a stronger-than-expected May jobs report pushed Treasury yields higher and revived bets that the Federal Reserve will stay on hold rather than cut.
Yet despite the drama, the S&P 500 is still up roughly 10% on the year and sits more than 19% above its March low. By the strict definition, this is not even a correction yet at the index level - it is a sharp pullback inside an ongoing uptrend. Several strategists have framed it as a rotation out of crowded AI names and into defensive sectors, not a market-wide breakdown.
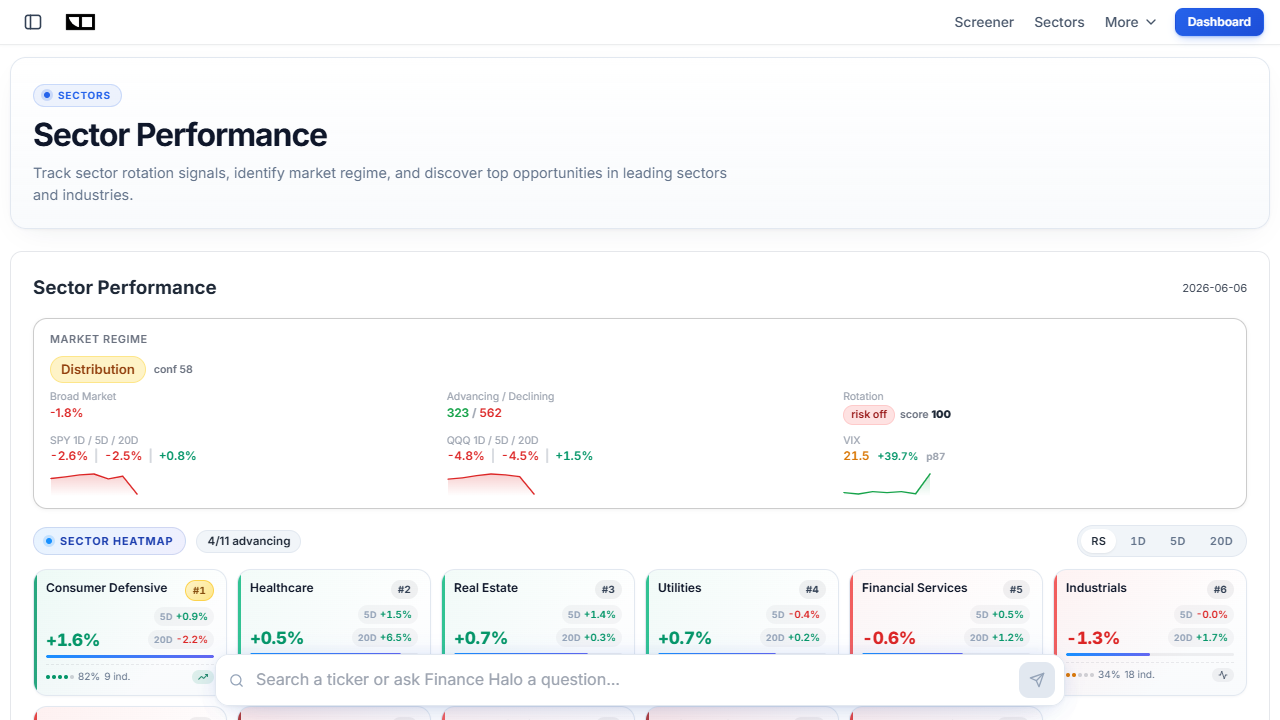
That sector picture - defensives up, high-flying chips down - is the signature of a rotation, not a panic. You can watch this dynamic in real time on Finance Halo's sector performance and rotation tracker, which flags the market regime as risk-on, risk-off, or neutral.
Real-World Example: 2022 Bear Market vs. the 2020 Flash Bear
To see how differently two bear markets can behave, compare the two most recent ones.
The 2020 COVID crash: fast and violent
In early 2020, the S&P 500 lost 33.9% in just 33 calendar days as the pandemic shut down the global economy. It was the fastest bear market in history. But because the cause was a sudden external shock rather than a slow structural rot, the rebound was equally fast: the index printed a new all-time high by August 2020, roughly five months from the bottom. An investor who panic-sold near the lows missed one of the sharpest recoveries ever recorded.
The 2022 bear market: slow and grinding
The 2022 bear market was the opposite in character. Driven by the Fed's most aggressive rate-hiking cycle in decades, the S&P 500 fell 25.4% over 282 days - shallower than 2020 in percentage terms, but far longer and more grinding. There was no single crash day; instead, a relentless series of lower highs and lower lows wore investors down over most of a year.
The lesson: depth and speed are independent. A 34% crash recovered in months, while a 25% bear market dragged on for the better part of a year. Before reacting to any decline, it pays to understand what is actually driving it. Our guide on how to analyze a stock before buying applies just as much to deciding what to hold through a downturn as it does to new purchases.
How Can You Tell Which One You Are In?
You can never know in real time whether a correction will become a bear market - the label is only confirmed after the fact. But you can read the warning signs that raise or lower the odds. Watch these signals:
- Market breadth. In a healthy correction, most stocks hold up and only a few crowded leaders fall. In a developing bear market, declines broaden across nearly every sector.
- The yield curve and credit spreads. Widening corporate credit spreads and a deeply inverted yield curve often precede recessions - and recession-linked bear markets.
- Earnings revisions. If analysts are still raising forward estimates, the economic engine is intact. Falling estimates are a bear-market tell.
- Sentiment extremes. A spike in the VIX and a collapse in sentiment gauges can mark a correction's bottom, but persistent fear with no bounce hints at something deeper.
- The 200-day moving average. A decisive break below the long-term trend line, especially a "death cross" of the 50-day below the 200-day, raises the risk that a correction is turning structural.
No single signal is decisive, which is why combining them matters. Our walkthrough on how to combine RSI, MACD, and moving averages shows how to layer technical indicators so you are not relying on any one of them in isolation.
How to Invest Through a Correction vs a Bear Market
The single most useful reason to tell a correction from a bear market is that the right response is different for each. Reacting to a routine correction as if it were a bear market is how investors lock in losses and miss the rebound.
What to do in a correction
- Keep buying on schedule. Corrections are short and usually reverse. Continuing to invest, or even adding, captures lower prices.
- Rebalance back to your targets. A 12% drop in stocks is a natural moment to top up to your intended allocation.
- Build a shopping list. Quality names you wanted are now cheaper. Screening for fundamentally strong, reasonably valued companies is far easier when prices have reset - Finance Halo's market screener lets you filter by sector, market cap, and P/E to find them.
What to do in a bear market
- Tighten your risk. If the evidence points to a structural bear market, raising some cash and trimming the most speculative positions is defensible.
- Lean defensive. Consumer staples, healthcare, and utilities historically hold up better - exactly the rotation visible on the sector tracker during the June 2026 selloff.
- Stay invested in quality. Even in bear markets, selling everything risks missing the violent recovery rallies that often deliver the best single days. For the long-term core of a portfolio, broad index exposure remains the simplest approach - see our comparison of MSCI World vs S&P 500 ETFs.
- Hunt for genuine value. The deepest discounts appear in bear markets. Our beginner's guide to deep value stocks explains how to separate cheap-for-a-reason from genuinely undervalued.
In both cases, the worst move is to abandon your plan entirely. Time in the market, not timing the market, is what compounds wealth - and the biggest up days cluster suspiciously close to the biggest down days.
Common Mistakes to Avoid
- Mistake 1: Selling at the first 10% drop. Most corrections never become bear markets. Panic-selling a routine correction often means buying back higher. Fix: decide your plan before the drop, not during it.
- Mistake 2: Assuming every bear market looks like 2008. The 2022 bear was a slow 25% grind and 2020 was a one-month crash. Fix: judge each decline by its actual cause, not your worst memory.
- Mistake 3: Trying to perfectly time the bottom. Nobody rings a bell at the low. Fix: scale in gradually with dollar-cost averaging instead of waiting for the "all clear."
- Mistake 4: Confusing a single stock's crash with a market regime. A stock can fall 30% on bad earnings while the index is fine. Fix: separate company-specific news from market-wide moves.
- Mistake 5: Ignoring valuations on the way up. Corrections hit overpriced markets hardest. Fix: trim or rebalance when valuations stretch, so a correction is a discount rather than a disaster.
- Mistake 6: Going fully to cash and staying there. Missing the market's best days devastates long-term returns, and those days often come during bear markets. Fix: keep a quality core invested through the cycle.
Frequently Asked Questions
What percentage drop is a correction vs a bear market?
A correction is a decline of more than 10% but less than 20% from a recent peak. A bear market is a decline of 20% or more. A fall of 5% to 10% is generally called a pullback or dip rather than a correction.
How long does a stock market correction usually last?
Corrections are typically short, lasting an average of three to four months from peak to recovery. Many resolve even faster, especially when the underlying economy is healthy and the drop was driven by sentiment rather than fundamentals.
Do all corrections turn into bear markets?
No. Going back to 1975, only 6 of 27 corrections deepened into a full bear market - roughly one in four. The large majority stop, reverse, and the market resumes its uptrend without ever crossing the 20% threshold.
How often do bear markets happen?
Bear markets occur on average about once every 3.5 years. There have been 27 of them in the S&P 500 since 1928. They are far less frequent than corrections, which happen roughly once every 19 months.
How long does it take to recover from a bear market?
It varies enormously. The median recovery from the trough to a new high is about 14 months, but the average is closer to 50 months because a few secular collapses (1929, 1937, 1973, 2000) skew it. The 2020 COVID bear recovered in about five months, while the 1929 crash took roughly 25 years.
Is it a good idea to buy stocks during a correction?
Historically, buying during corrections has rewarded patient investors because most corrections reverse within months. The key is to buy quality at reasonable valuations and to scale in gradually rather than betting everything on calling the exact bottom.
Is the June 2026 selloff a correction or a bear market?
As of early June 2026 it is neither at the index level - it is a sharp pullback inside an uptrend. The S&P 500 is still up about 10% on the year despite the chip-led drop, and the move looks more like a rotation out of AI names into defensives than a market-wide breakdown.
What is the difference between a bear market and a crash?
A crash is not defined by size but by speed: it is a steep 20%+ decline that happens in a very short window, often days. A bear market can unfold slowly over many months. The 2020 COVID drop was both a crash and a bear market; the 2022 decline was a bear market but not a crash.
Conclusion
The correction vs bear market distinction is more than vocabulary - it is the difference between a routine 10% to 20% reset and a 20%-plus crisis of confidence that can last the better part of a year. Corrections are frequent (about 64% of years see one), short (three to four months), and usually buying opportunities. Bear markets are rarer (every 3.5 years), deeper (around 33% on average), and demand a more defensive posture.
The most important fact to remember is that most corrections never become bear markets - only 6 of the last 27 did. That base rate is why panic-selling every dip is so costly, and why the June 2026 chip selloff, with the S&P 500 still up double digits on the year, looks far more like a rotation than a regime change. Match your response to the regime: keep buying through corrections, tighten risk if a true bear market takes hold, and never abandon a quality core. Do that, and market declines become a tailwind for long-term returns rather than a threat to them.
Try it yourself: Use Finance Halo's AI assistant to get instant analysis on any stock, sector, or index. Just type a ticker and ask whether the latest move is a routine dip or something bigger.
Disclaimer: This article is for educational purposes only and does not constitute investment advice. Always do your own research before making investment decisions.