What Is an Inverted Yield Curve?
6/16/2026
An inverted yield curve is the bond market's most famous recession alarm - the rare moment when short-term Treasuries pay more than long-term ones. It has preceded every US recession since 1955, with just one false alarm. Here is how to read it, what it is signaling in 2026, and how to position your portfolio.
What Is an Inverted Yield Curve?
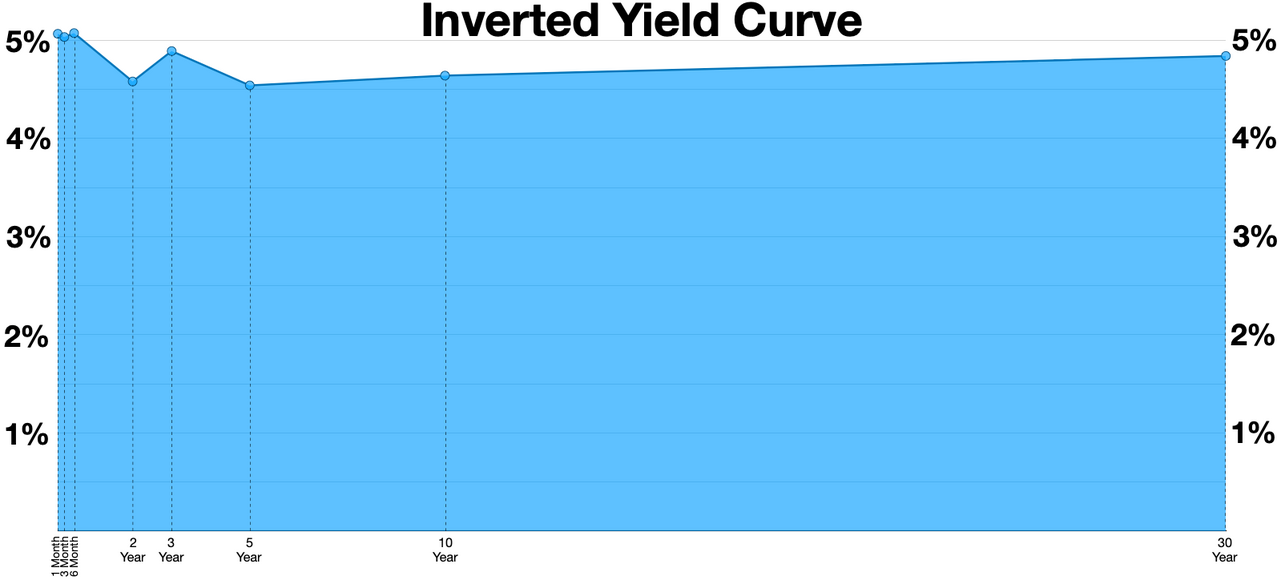
An inverted yield curve is a situation in the bond market where short-term US Treasury securities yield more than long-term ones. Normally you get paid extra to lend money for longer, so a 10-year Treasury yields more than a 2-year. When that relationship flips - when the 2-year out-yields the 10-year - the curve is said to be "inverted."
The yield curve itself is just a line plotting the interest rate (yield) of Treasury bonds across maturities, from the 1-month bill out to the 30-year bond. Most of the time it slopes upward. An inversion turns that slope downward at the front end, and it is one of the few indicators with a genuinely impressive recession-forecasting record.
Because it draws on the collective bets of the entire bond market - the deepest, most liquid market in the world - the yield curve is often described as a real-time poll of what millions of investors expect for growth, inflation, and Federal Reserve policy. When that crowd is willing to accept a lower yield to lock in a 10-year bond than to hold a 2-year, it is effectively saying it expects rates (and the economy) to be weaker down the road.
How the Yield Curve Normally Works
To understand an inversion, you first need the baseline. The yield curve generally takes one of three shapes, and each tells a different macro story.
| Curve Shape | What It Looks Like | What It Signals |
|---|---|---|
| Normal (upward) | Long yields > short yields | Healthy expansion; investors demand a term premium for time and inflation risk |
| Flat | Short and long yields nearly equal | Transition; the market is unsure about growth - often late cycle |
| Inverted (downward) | Short yields > long yields | Markets expect rate cuts ahead, usually because growth is slowing |
Why a normal curve slopes up
In a healthy economy, lenders demand more compensation to tie up money for 10 or 30 years than for a few months. That extra compensation is called the term premium - it covers the risk that inflation erodes your purchasing power and that rates could rise before your bond matures. A positive term premium pushes long yields above short ones, giving the curve its usual upward tilt.
The mechanics of the slope
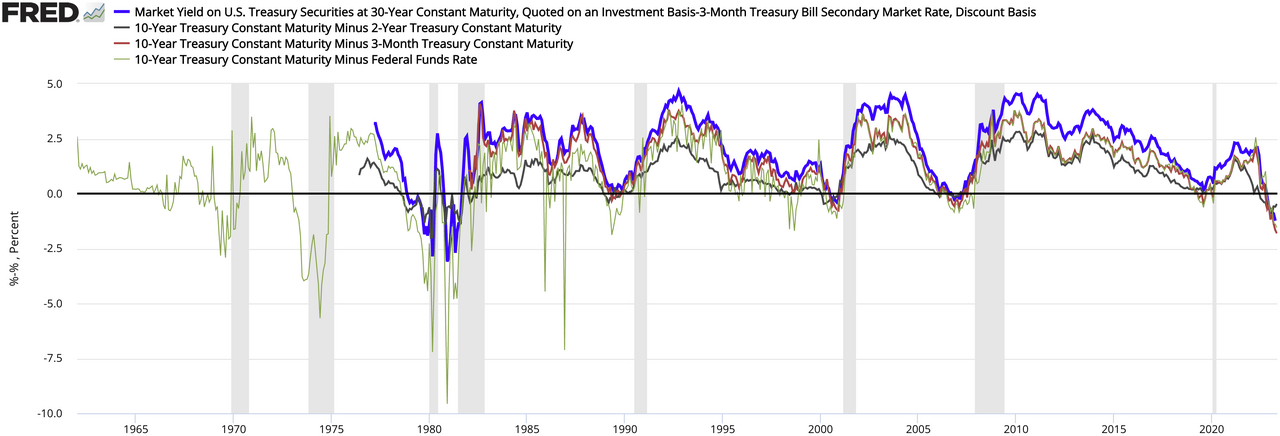
The simplest way to measure the slope is a spread - one yield minus another:
When that number is positive, the curve is normal. When it crosses below zero, the curve has inverted. A spread of +1.2 percentage points is healthy; a spread of -0.5 (minus 50 basis points) is a deep inversion. You can track these spreads live on FRED, the St. Louis Fed's free data portal.
Why Does the Yield Curve Invert?
An inversion is not random. It is the predictable result of two forces pulling the front and back of the curve in opposite directions.
The short end follows the Fed
Short-term yields (the 3-month bill, the 2-year note) track the Federal Reserve's policy rate very closely. When the Fed hikes aggressively to fight inflation - as it did in 2022-2023 - the front end of the curve shoots up. Understanding this link is easier if you also know how the Fed shrinks its balance sheet; our guide to quantitative tightening (QT) covers the other half of modern monetary policy.
The long end follows growth and inflation expectations
Long-term yields (the 10-year, the 30-year) are driven less by today's Fed and more by where investors think growth, inflation, and rates are heading over the next decade. If the bond market believes the Fed's hikes will succeed in cooling the economy - eventually forcing rate cuts - it bids up long bonds, pushing their yields down.
Put those two together and you get an inversion: the Fed jams the short end up while the market drags the long end down. The curve flips. In plain English, the bond market is forecasting that current policy is too tight to last, and that slower growth - or an outright recession - will force the Fed to reverse course.
2s10s vs 10Y-3M: Which Spread Matters?
You will hear two different spreads quoted, and they do not always invert at the same time. Both are worth watching, but they answer slightly different questions.
- The 2s10s (10-year minus 2-year): The most-quoted spread in financial media. It is sensitive and tends to invert early, sometimes a year or more before a recession.
- The 10Y-3M (10-year minus 3-month): The Federal Reserve's preferred measure. The 3-month bill hugs the current policy rate, so this spread captures the gap between policy right now and long-run expectations. Research finds it has the cleanest forecasting record.
The New York Fed recession model
Economists Arturo Estrella and Frederic Mishkin formalized this in a landmark 1998 paper, and the Federal Reserve Bank of New York now publishes a monthly recession-probability series based on it. The model is a probit regression on the 10Y-3M spread:
Here is the standard normal cumulative distribution function and is the 10Y-3M spread in percentage points. The intuition is simple: the more inverted the spread, the higher the modeled probability of recession 12 months out.
| 10Y-3M Spread | Modeled 12-Month Recession Probability |
|---|---|
| +1.2 percentage points | Under 5% |
| 0 (curve flat) | Roughly 25% |
| -0.5 percentage points (inverted) | Materially higher; deep inversions have historically pushed the model toward 40%+ |
The Estrella-Mishkin work showed that this spread out-forecast many respected indicators, including the Commerce Department's index of leading economic indicators and the stock market itself. You can read the original framework in the New York Fed's published research.
Why Is an Inverted Yield Curve a Recession Signal?
The reason the yield curve gets so much attention is its track record. A sustained inversion has preceded every US recession since 1955, with a single famous exception: the mid-1960s inversion was followed by a sharp slowdown but not an official recession dated by the National Bureau of Economic Research (NBER). That is one false alarm in roughly seven decades.
It is a lead indicator, not a stopwatch
The most misunderstood part of the signal is timing. The curve has historically inverted 6 to 24 months before a recession begins - a wide and frustrating window. Inversions that last longer than three months are far more reliable: studies put their hit rate around 73%, versus roughly 45% for brief, shallow inversions that quickly reverse.
Why the lag, and why re-steepening matters
Counterintuitively, recessions often arrive only after the curve "un-inverts" and re-steepens. That happens when the Fed, seeing the economy crack, finally slashes short-term rates - pulling the front of the curve back below the long end. So a steepening curve after a long inversion can be a more urgent warning than the inversion itself. This is also why a single day of inversion means little; what matters is depth and persistence.
Case Study: The Longest Inversion in History (2022-2024)
The most recent episode is a perfect teaching case - and a cautionary one. To crush 9% inflation, the Fed hiked from near zero to a 5.25%-5.50% target range in 2022-2023. That sent the front of the curve soaring and produced the longest yield-curve inversion on record.
- By the 10Y-3M measure, the curve was inverted from October 25, 2022 to December 13, 2024 - roughly 26 months, smashing the prior 19-month record set during the late-1970s "Great Stagflation."
- At its deepest, the 2s10s inversion reached about -2.1 percentage points (210 basis points), one of the steepest on record, reflecting how hard the Fed slammed the brakes.
- Crucially, no recession immediately followed. The economy kept growing, unemployment stayed low, and the much-feared downturn never showed up on schedule.
That outcome reopened a fierce debate: is the yield curve broken? Skeptics argue that years of quantitative easing distorted long-term yields and muted the signal. Defenders counter that the indicator was never a stopwatch - the lag can run beyond two years, and a soft landing does not erase a 70-year record. Either way, the 2022-2024 episode is a reminder that the curve forecasts risk, not certainty. If you want to understand how a downturn would actually feel in markets, our explainer on the difference between a correction vs a bear market is a useful companion.
What Does the Yield Curve Look Like in 2026?
As of mid-June 2026, the picture is unusually delicate. After re-steepening out of its historic inversion, the curve is technically normal but very flat:
- The Fed has held its target range at 3.50%-3.75% heading into Kevin Warsh's first FOMC meeting on June 17.
- The 10-year Treasury yield sits near 4.4%, while sticky May CPI of 4.2% keeps the front end elevated.
- The 2s10s spread is barely positive, and the 10Y-3M just slipped back below zero - a textbook late-cycle signature where the market is whispering caution even as headline growth holds.
What makes 2026 different from a classic late cycle is the direction of policy risk. Instead of pricing rate cuts, fed funds futures have shifted toward pricing a possible hike by year-end, as inflation refuses to fully cool. A curve that flattens because the long end is rising on inflation fear is a different animal from one that inverts because growth is collapsing - and telling those two apart is exactly where a daily macro read earns its keep.
How an Inverted Yield Curve Affects Your Portfolio
An inversion is not just an academic curiosity - it ripples through nearly every asset class. Here is how the major ones typically respond.
Stocks
Equities do not crash the moment the curve inverts. In fact, the S&P 500 has often kept rising for months afterward, which is precisely what traps investors who sell too early. The risk builds over the following year as the lagged effects of tight policy bite into earnings. You can track index-level action through an ETF like the SPDR S&P 500 ETF (SPY).
Banks
Banks are the textbook losers. They borrow short and lend long, so they profit from the gap between short and long rates - the net interest margin. An inverted curve compresses that margin, which is why financials like JPMorgan (JPM) often see pressure on lending profitability during sustained inversions.
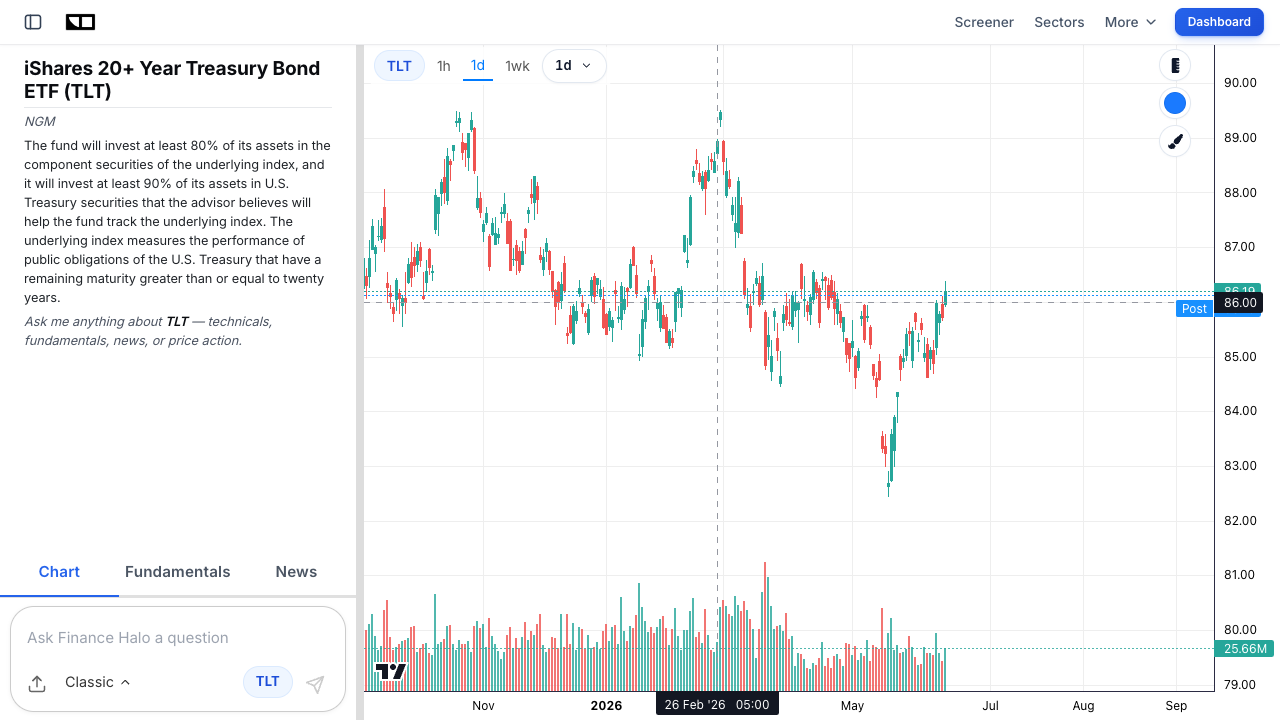
Bonds
For bond investors, an inversion creates an awkward choice. Short-term Treasuries like the iShares 1-3 Year Treasury Bond ETF (SHY) pay more income, but if the Fed eventually cuts, that income evaporates on reinvestment. Long-duration bonds like the iShares 20+ Year Treasury Bond ETF (TLT) lock in today's yield and can deliver large price gains if rates fall - the classic recession hedge.
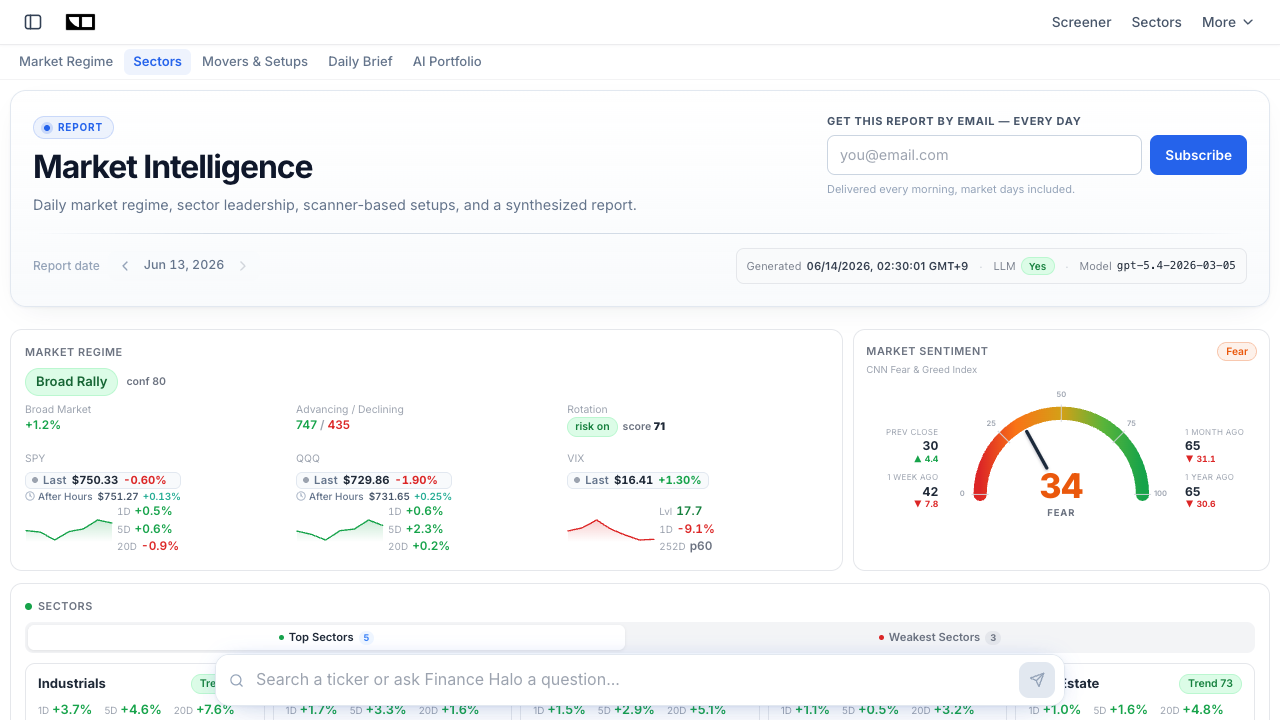
Market sentiment
An inversion also feeds the psychology of the market. As recession headlines build, sentiment gauges like the Fear & Greed Index swing toward fear - which can itself become a contrarian signal. Here is the live reading:
How to Position for (and After) an Inversion
You cannot trade the yield curve like a light switch, but you can use it to tilt risk. Here is a practical, step-by-step framework.
- Confirm depth and persistence. Ignore a one-day blip. Look for an inversion (especially the 10Y-3M) that holds for more than three months - that is the historically reliable version.
- Watch for the re-steepening. Treat the moment the curve climbs back above zero as a heightened-alert signal, since recessions often start shortly after.
- Lengthen bond duration gradually. If you expect the Fed to eventually cut, extending into longer-duration Treasuries can lock in yield and add a price cushion. Do it in tranches, not all at once.
- Tilt equities toward quality and defensives. Strong balance sheets, stable cash flows, and defensive sectors (staples, utilities, healthcare) historically hold up better as growth slows.
- Keep dry powder. Cash and short bills yield a lot during an inversion, so you are paid to wait for better entry points.
- Use a screener to find resilient names. Filter for low debt, healthy margins, and reasonable valuations with the Finance Halo stock screener rather than guessing.
One discipline matters above all: do not abandon your plan on a single signal. Pairing curve-watching with a steady approach like dollar-cost averaging keeps you invested through the long, uncertain lag between inversion and recession - the exact window where impatient investors get hurt. For broader protection, see our playbook on hedging a portfolio against macro risk.
Common Mistakes to Avoid
- Treating it as a timing signal. The curve says "risk is rising," not "sell tomorrow." Acting the day it inverts has historically meant leaving months of gains on the table. Fix: respect the 6-to-24-month lag.
- Watching only the 2s10s. The headline 2s10s can give different timing than the Fed-preferred 10Y-3M. Fix: track both, and weight the 10Y-3M for recession odds.
- Panicking on a one-day inversion. Brief, shallow inversions that reverse within days have a weak record. Fix: require persistence (3+ months) and depth.
- Ignoring why the curve moved. A flattening driven by rising long yields (inflation fear) is different from one driven by falling long yields (growth fear). Fix: check what is moving - the front end or the back end.
- Going all-in on long bonds too early. If inflation reaccelerates, long-duration bonds can lose value before any cut arrives. Fix: extend duration in stages.
- Forgetting the re-steepening. Many investors relax once the curve un-inverts, exactly when historical recession risk peaks. Fix: stay alert through the steepening phase.
Frequently Asked Questions
Does an inverted yield curve always mean a recession is coming?
Not always, but the odds are high. A sustained inversion has preceded every US recession since 1955 with only one false alarm. The 2022-2024 inversion did not produce an immediate recession, which fueled debate about whether the signal still works - but its long-run record remains the best of any single indicator.
How long after an inversion does a recession usually start?
Historically, anywhere from 6 to 24 months later. The lag is long and variable, which is why the curve is best treated as a lead indicator of rising risk rather than a precise countdown. Recessions also frequently begin only after the curve re-steepens.
What is the difference between the 2s10s and the 10Y-3M spread?
The 2s10s (10-year minus 2-year) is the most-quoted spread and tends to invert early. The 10Y-3M (10-year minus 3-month) is the Federal Reserve's preferred recession gauge because the 3-month bill closely tracks the current policy rate, giving it the cleanest forecasting record.
Why do bond investors buy long-term bonds that pay less?
Because they expect rates to fall. If you believe the Fed will be forced to cut, locking in today's long-term yield protects your income, and the bond's price rises as rates drop. Investors accept a lower yield now to avoid reinvesting at much lower rates later.
Is the yield curve inverted right now in 2026?
As of mid-June 2026, the curve is normal but very flat. The 2s10s is barely positive while the 10Y-3M has just slipped slightly below zero - a late-cycle signature. This follows the record 2022-2024 inversion that has since unwound. You can monitor the macro backdrop on the Finance Halo dashboard.
Can the Fed prevent a recession after an inversion?
Sometimes. The 2022-2024 episode is the clearest modern example of an inversion not being followed by an immediate recession - a so-called soft landing. The Fed influences the short end directly, so well-timed rate cuts can ease pressure, but policy works with long lags and success is never guaranteed.
What assets do well during a yield curve inversion?
Short-term Treasuries and cash pay attractive yields during an inversion. If a slowdown follows, long-duration Treasuries, gold, and defensive equity sectors (staples, utilities, healthcare) have historically held up better than cyclical growth stocks.
How do I track the yield curve myself?
The St. Louis Fed's free FRED database publishes the 2s10s and 10Y-3M spreads daily, and the New York Fed posts its monthly recession-probability model. For a live market read alongside sector and sentiment data, the Finance Halo market intelligence dashboard bundles the macro picture in one place.
Conclusion
The inverted yield curve earns its reputation as the bond market's recession alarm for a reason: a sustained inversion has flagged every US downturn since 1955, with only one false signal. But its power lies in nuance, not drama. It is a lead indicator with a 6-to-24-month lag, the 10Y-3M spread forecasts more cleanly than the famous 2s10s, and recessions often arrive only after the curve re-steepens.
The record 2022-2024 inversion - the longest ever, yet followed by no immediate recession - proves the signal forecasts risk, not certainty. In 2026, with the curve flat and the Fed flirting with hikes instead of cuts, the smart move is not to predict the exact turn but to manage risk: confirm depth and persistence, lengthen bond duration in stages, tilt toward quality, and keep dry powder. Read the curve as a barometer, not a stopwatch, and it becomes one of the most valuable tools in your kit.
Try it yourself: Use Finance Halo's AI assistant to get instant analysis on any stock, ETF, or macro question. Just type a ticker and ask about the yield curve, rates, or recession risk.
Disclaimer: This article is for educational purposes only and does not constitute investment advice. Always do your own research before making investment decisions.