What Is Enterprise Value (EV)?
6/19/2026
Enterprise value (EV) is the price tag on an entire business, not just its stock. It answers a deceptively simple question: if you bought the whole company tomorrow, what would it really cost you? Master enterprise value and you will value stocks the way acquirers, private equity firms, and seasoned analysts do.
What Is Enterprise Value (EV)?
Enterprise value (EV) is a measure of a company's total worth that captures the entire capital structure - both the equity owned by shareholders and the debt owed to lenders - net of the cash sitting on the balance sheet. In plain English, enterprise value is the theoretical price you would pay to acquire a business outright and walk away owning all of it, free and clear.
Think of it like buying a house with an existing mortgage. The sticker price is not the whole story. If you take over a $500,000 house that still carries a $200,000 mortgage, your true cost is the equity you pay the seller plus the debt you assume. If the seller also leaves $20,000 of cash in a safe in the kitchen, your effective cost drops by that amount. Enterprise value applies exactly the same logic to an entire company.
This is why enterprise value is the metric that acquirers, private equity firms, and investment bankers reach for first. When one company buys another, it does not just buy the stock - it inherits the target's debts and gets to use the target's cash. Market capitalization, by contrast, only tells you what the equity is worth. EV tells you what the business is worth.
Enterprise value is a cornerstone of analyzing a stock before you buy it, and it sits at the heart of the most reliable valuation multiples on Wall Street. Before we get to those multiples, let's nail down the formula.
The Enterprise Value Formula
The core enterprise value formula is short and intuitive:
The middle two terms are often combined into a single concept called net debt:
If a company carries more cash than debt, net debt is negative (a "net cash" position), and enterprise value lands below market cap. If a company is loaded with debt, net debt is large and positive, and EV climbs well above market cap.
The complete formula (for the purists)
The textbook version of enterprise value includes two extra line items that matter for companies with complex capital structures:
- Preferred equity: preferred shares behave like debt (fixed claims that rank ahead of common stock), so an acquirer must account for them.
- Minority (non-controlling) interest: when a company consolidates a subsidiary it does not fully own, EBITDA and revenue include 100% of that subsidiary, so EV adds back the slice owned by outside shareholders to keep the numerator and denominator consistent.
For most large, simple companies these two terms are zero, which is why the streamlined "market cap + debt - cash" version is the one you will use 90% of the time.
A note on "total debt" and "cash"
Two practical points trip up beginners:
- Total debt means short-term debt plus long-term debt, including the current portion of long-term debt and, increasingly, capitalized operating leases. It does not mean total liabilities - accounts payable and deferred revenue are operating items, not financing, so they are excluded.
- Cash usually means cash, cash equivalents, and short-term marketable securities. Some data providers net out only cash and equivalents and leave longer-dated investments in place, which is why two reputable websites can quote slightly different EV figures for the same stock. The method matters less than applying it consistently across the companies you compare.
You can pull both line items straight from a company's audited financial statements - the annual 10-K or quarterly 10-Q filed on the SEC's EDGAR database - rather than trusting a third-party summary.
Enterprise Value vs. Market Cap: What's the Difference?
Market capitalization (market cap) is simply the share price multiplied by the number of shares outstanding. It is the value of the equity - what the stock market says the shareholders' stake is worth. It is the number you see quoted everywhere, and it is the headline metric on the Finance Halo screener.
The problem is that market cap is blind to the balance sheet. Two companies can sport the exact same market cap while one is debt-free and cash-rich and the other is drowning in borrowings. Enterprise value is what separates them.
| Dimension | Market Capitalization | Enterprise Value |
|---|---|---|
| What it measures | Value of the equity only | Value of the whole business (equity + debt - cash) |
| Formula | Share price × shares outstanding | Market cap + total debt - cash |
| Includes debt? | No | Yes |
| Includes cash? | No | Yes (subtracted) |
| Best paired with | P/E ratio, EPS, P/S | EV/EBITDA, EV/Sales, EV/EBIT |
| Whose view it reflects | A passive minority shareholder | A buyer of the entire company |
A quick mental model: market cap is the price of the keys to the car; enterprise value is the price of the keys plus the outstanding car loan, minus the gas already in the tank. When you compare valuations across companies with different debt loads, enterprise value is the fairer yardstick - and it pairs naturally with the P/E ratio rather than replacing it.
Why Do You Add Debt and Subtract Cash?
This is the single most important intuition in the whole topic, so it is worth slowing down. Imagine you are about to buy a corner store outright.
Why debt is added
When you acquire the business, you do not just pay the owner for their equity - you also become responsible for the store's outstanding loans. That debt is a real cost of ownership. Either you pay it off or you keep servicing the interest. So the more debt a target carries, the more expensive it is to truly own, and enterprise value adds debt to reflect that.
Why cash is subtracted
Now suppose the store has $50,000 sitting in its bank account on the day you buy it. The moment the deal closes, that cash is yours. You could use it to immediately repay part of the purchase price. In effect, the cash reduces your net outlay, so enterprise value subtracts cash. A cash-rich company is cheaper to acquire than its market cap suggests, because you are partly buying back your own money.
Put the two together and enterprise value answers the acquirer's real question: "After I take on the debts and help myself to the cash, what is my net cost to own this entire business?" That is a far more honest figure than market cap alone.
How to Calculate Enterprise Value: A Worked Example
Let's calculate enterprise value for a company everyone knows: Apple (AAPL). Using balance-sheet figures from mid-June 2026, Apple's profile looked roughly like this:
- Market capitalization: about $4.38 trillion
- Total debt: about $85 billion
- Cash, equivalents and marketable securities: about $147 billion
Plug those into the formula:
So Apple's enterprise value was roughly $4.32 trillion - about $60 billion below its market cap. Why? Because Apple holds more cash than debt, a net cash position of about $62 billion. For a hypothetical acquirer, all that cash effectively discounts the purchase price. This is the signature of a fortress balance sheet.
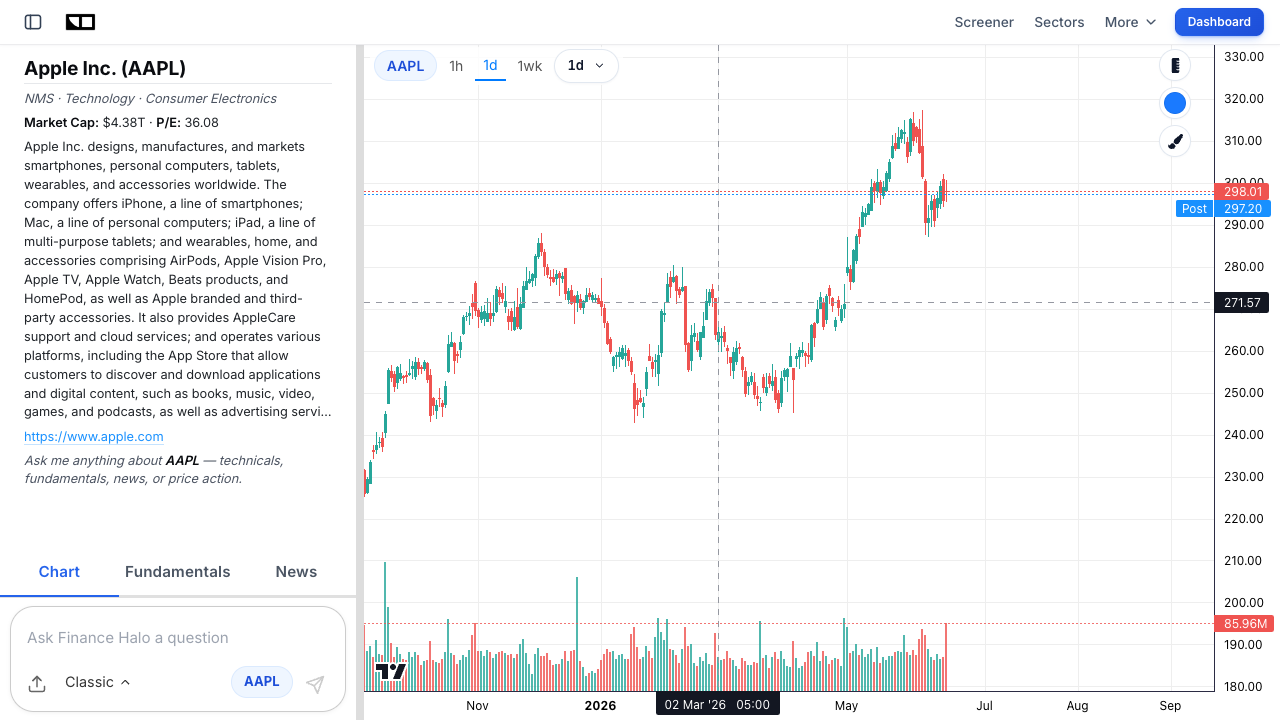
Notice the nuance: some data providers list Apple's EV slightly higher (closer to $4.4 trillion) because they only subtract cash and equivalents and leave longer-dated investments on the table. Both are defensible - what matters is using one consistent definition when you stack Apple against its peers. You can watch these inputs move in real time below.
Case Study: Apple vs. AT&T - Same Metric, Opposite Stories
Enterprise value really earns its keep when you compare two very different balance sheets. Apple is a net-cash juggernaut. AT&T (T), the telecom giant, is the opposite - a capital-intensive business that funds its sprawling network with mountains of debt. Here is how the two looked in mid-June 2026:

| Metric | Apple (AAPL) | AT&T (T) |
|---|---|---|
| Market capitalization | ~$4,380 billion | ~$153 billion |
| Total debt | ~$85 billion | ~$174 billion |
| Cash & investments | ~$147 billion | ~$37 billion |
| Net debt | -$62 billion (net cash) | +$137 billion |
| Enterprise value | ~$4,318 billion | ~$290 billion |
| EV vs. market cap | EV is ~1.4% lower | EV is ~89% higher |
The contrast is striking. AT&T's enterprise value of about $290 billion is nearly double its $153 billion market cap, because a buyer would have to assume roughly $174 billion of debt. Apple's enterprise value sits slightly below its market cap. If you only looked at market cap, you would badly understate what it costs to own AT&T and slightly overstate what it costs to own Apple.
This is exactly why EV-based multiples are so valuable: they let you compare a debt-light tech company and a debt-heavy telecom on a level playing field. AT&T's debt is not necessarily a red flag - telecoms run high leverage by design, and AT&T's interest coverage ratio of roughly 4.7x suggested it could comfortably service that debt - but you cannot see any of that nuance from market cap alone.
Enterprise Value Multiples: EV/EBITDA, EV/Sales, EV/EBIT
Enterprise value is most powerful as the numerator of a valuation multiple. Because EV represents the value of the whole business (debt and equity together), you pair it with a profit or revenue figure that also belongs to the whole business - one measured before interest payments to lenders. That is what makes EV multiples "capital-structure neutral."
EV/EBITDA
The most popular EV multiple is EV/EBITDA, which compares enterprise value to earnings before interest, taxes, depreciation, and amortization:
It tells you how many years of pre-tax, pre-financing cash earnings it would take to pay back the cost of buying the entire business. Because EBITDA strips out interest expense and depreciation policies, EV/EBITDA lets you compare companies with different debt loads, tax situations, and asset bases. If you are fuzzy on the denominator, our guide to what EBITDA is and how to calculate it breaks it down step by step.
EV/Sales (EV/Revenue)
When a company is unprofitable - common for young, high-growth firms - EBITDA can be negative and EV/EBITDA becomes meaningless. EV/Sales steps in:
It is the enterprise-value cousin of the price-to-sales ratio, and it is widely used to value software and biotech names that are scaling revenue faster than profits.
EV/EBIT
EV/EBIT uses earnings before interest and taxes, which - unlike EBITDA - keeps depreciation in the picture. For capital-intensive businesses where depreciation reflects real, recurring equipment spending (airlines, telecoms, manufacturers), EV/EBIT can be the more honest multiple.
| Multiple | Denominator | Best for | Watch out for |
|---|---|---|---|
| EV/EBITDA | EBITDA | Cross-industry comparisons; leveraged buyouts | Ignores real capex via depreciation add-back |
| EV/Sales | Revenue | Unprofitable or hyper-growth companies | Says nothing about margins or profitability |
| EV/EBIT | EBIT (operating income) | Capital-intensive, asset-heavy firms | Sensitive to depreciation accounting choices |
The common thread: every one of these beats the P/E ratio when debt levels differ across the companies you are comparing, because the P/E ratio's denominator (net income) is calculated after interest expense, which bakes in capital-structure differences. For a deeper look at where P/E still shines and where it falls short, see our complete P/E vs EPS vs PEG comparison.
What Is a Good EV/EBITDA Ratio?
As a rough rule of thumb, an EV/EBITDA below about 10x has traditionally been viewed as inexpensive, while figures in the high teens or above signal that the market is pricing in strong growth. But "good" is entirely relative to the sector, the growth rate, and the prevailing interest-rate environment.
| Profile | Typical EV/EBITDA range | Interpretation |
|---|---|---|
| Mature, slow-growth (utilities, telecom) | ~6x - 9x | Stable cash flows, limited upside |
| Broad market / industrials | ~9x - 14x | Average growth and risk |
| High-growth tech & software | ~18x - 30x+ | Premium for rapid expansion |
| Cyclical at a trough | Can look very high or very low | EBITDA is temporarily distorted - be careful |
Three guardrails when judging EV/EBITDA:
- Always compare within an industry. A 12x multiple is cheap for a fast grower and expensive for a no-growth utility.
- Do not use it for banks and insurers. EBITDA is not a meaningful concept for financial companies, where interest is a core part of operations - most providers exclude the financial sector from EV/EBITDA entirely.
- Mind the cycle. For cyclical businesses, a temporarily depressed EBITDA can make a stock look expensive at exactly the wrong moment, and an inflated peak EBITDA can make it look cheap right before earnings roll over.
Used well, a low EV/EBITDA is one of the building blocks of a deep value investing strategy - it helps you find businesses the market is pricing cheaply relative to the cash they actually generate.
What Does a Negative Enterprise Value Mean?
Occasionally you will run a screen and find a company with a negative enterprise value. It happens when a company's cash exceeds its market cap plus its debt. Rearranging the formula, EV goes negative whenever:
Here is a simple illustration. Suppose a company has a $100 million market cap, zero debt, and $120 million of cash:
An enterprise value of negative $20 million implies something almost absurd: in theory you could buy the entire company for $100 million, immediately claim its $120 million of cash, and walk away $20 million ahead while keeping the operating business for free. In practice the market rarely lets such gifts persist, and when it does there is usually a reason - cash burn, governance issues, or a business the market expects to destroy that cash.
Still, negative-EV stocks are a genuine deep-value niche. A widely cited CFA Institute study found that a basket of negative-enterprise-value stocks historically delivered outsized average returns - "money for nothing," as the authors put it - precisely because these situations are rare, small, and overlooked. The catch: they are usually tiny, illiquid companies, and the cheap cash can evaporate if management spends it poorly.
How Investors Use Enterprise Value in Practice
Knowing the formula is one thing; using it is another. Here is a practical workflow you can run today.
- Start with a peer group. Pick three to five competitors in the same industry. EV multiples are only meaningful in comparison, so never analyze one in isolation.
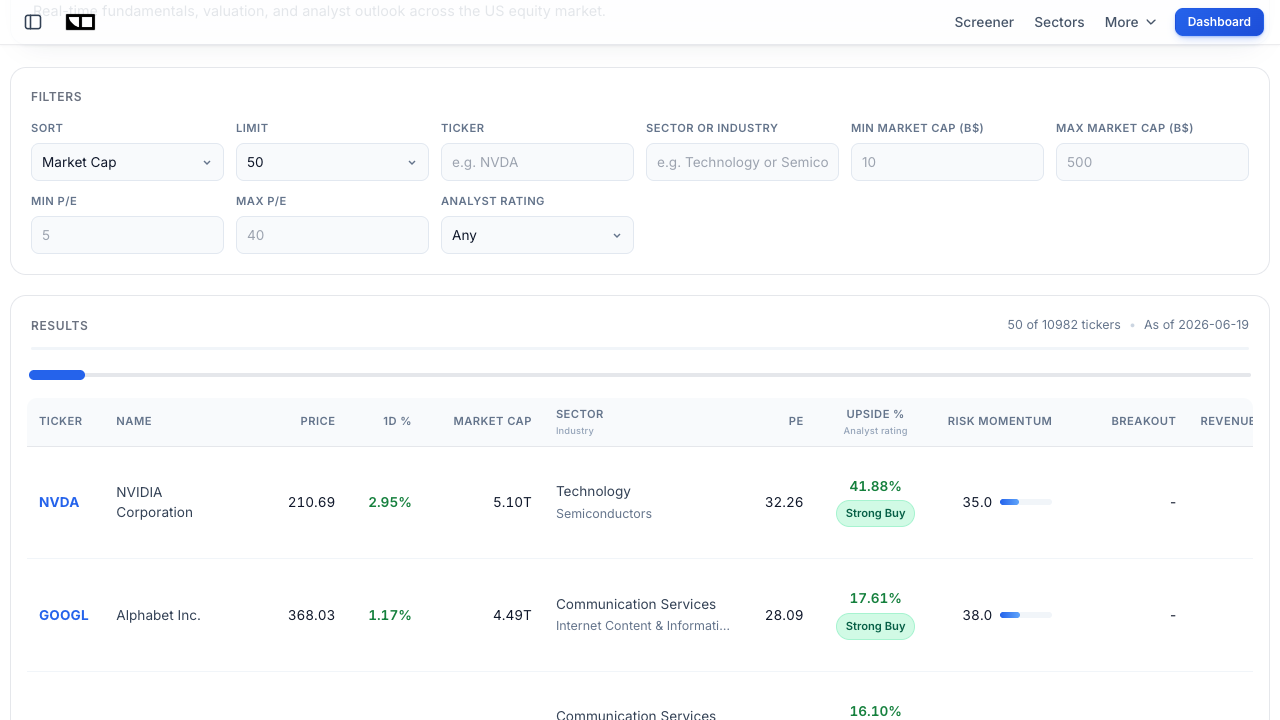
- Pull market cap, debt, and cash for each. The Finance Halo screener lists market cap, sector, and core fundamentals side by side, so you can filter a sector and gather the inputs in one place.
- Compute EV and EV/EBITDA for each name. The company with the lowest EV/EBITDA relative to its growth rate is your candidate for "cheap."
- Cross-check with quality scores. A low multiple is only attractive if the business is healthy. The Finance Halo stock-score screener ranks names on a Deep Value score, which leans on exactly this kind of valuation discipline, alongside momentum and risk metrics.
- Ask why it is cheap. A genuinely low EV/EBITDA might signal opportunity - or a value trap. Read the latest news and earnings before you act.
You can shortcut steps two through five by letting AI do the heavy lifting. Type a ticker into Finance Halo's AI assistant and ask "what is this company's enterprise value and EV/EBITDA, and how does it compare to peers?" - you will get the calculation and the context in seconds. If you are weighing the macro backdrop too, the AI-generated market intelligence dashboard frames how rates and sentiment are tilting valuations across sectors.
For context on how EV-based valuation slots in alongside the metrics most beginners learn first, compare it with our breakdown of forward versus trailing P/E - the same "what are you really paying for" instinct applies.
Common Mistakes to Avoid
- Confusing total debt with total liabilities. Enterprise value uses interest-bearing debt, not the entire liabilities column. Lumping in accounts payable or deferred revenue inflates EV and understates how cheap a stock is.
- Forgetting to subtract cash. Skipping the cash term overstates the cost of cash-rich companies like NVIDIA (NVDA) or Alphabet (GOOGL). The net-cash discount is often the most important part of the calculation.
- Comparing EV/EBITDA across unrelated industries. A software company and a utility will always have different "normal" multiples. Compare within a sector, not across the whole market.
- Applying EV/EBITDA to banks. For financial companies, EBITDA is not meaningful and EV is distorted by how they fund their balance sheets. Use price-to-book or P/E instead.
- Trusting a single data provider's EV blindly. Because cash and lease definitions vary, two sites can quote different EV numbers. Understand the method behind the figure before you lean on it.
- Treating high EV as automatically bad. AT&T's EV towers over its market cap, but that leverage is a deliberate, manageable feature of the telecom model - context, not the raw number, is what matters.
Frequently Asked Questions
What is enterprise value in simple terms?
Enterprise value is the total price to buy an entire company: its market cap plus the debt you would have to assume, minus the cash you would inherit. It reflects a buyer's true cost of ownership, not just the value of the stock.
Is enterprise value the same as market cap?
No. Market cap values only the equity (share price times shares outstanding). Enterprise value adds debt and subtracts cash, so it captures the value of the whole business. They are equal only when a company has exactly as much cash as debt.
Can enterprise value be negative?
Yes. When a company holds more cash than its market cap plus debt combined, enterprise value turns negative. It is rare, usually limited to small or distressed companies, and is treated as a deep-value signal worth investigating carefully.
Why is enterprise value better than the P/E ratio for some comparisons?
The P/E ratio is calculated after interest expense, so it is skewed by how much debt a company carries. Enterprise value multiples like EV/EBITDA are capital-structure neutral, which makes them fairer when you compare companies with very different debt loads.
What is a good EV/EBITDA ratio?
It depends on the sector. Roughly, below 10x is often considered cheap and high-teens or above signals a growth premium. Mature utilities trade near 6x to 9x while fast-growing software can exceed 25x, so always compare within an industry.
Do you use total debt or net debt in enterprise value?
Both views are equivalent. The standard formula adds total debt and then subtracts cash. Combining those two steps gives net debt (total debt minus cash), so EV equals market cap plus net debt. Use whichever framing is clearer to you.
Why does enterprise value subtract cash?
Because a buyer who acquires the company gets to keep its cash and could immediately use it to offset the purchase price. Cash effectively reduces the net cost of ownership, so it is subtracted from enterprise value.
Should I use enterprise value for valuing banks?
Generally no. For banks and insurers, debt and interest are part of normal operations and EBITDA is not meaningful, so enterprise value and EV/EBITDA give distorted results. Metrics like price-to-book value and return on equity are more appropriate.
Conclusion
Enterprise value is the metric that turns you from a casual stock-watcher into someone who thinks like an acquirer. By taking market cap, adding the debt a buyer must assume and subtracting the cash they would inherit, enterprise value reveals what a business truly costs - a number market cap alone can miss by a wide margin, as Apple's net-cash discount and AT&T's debt-driven premium make clear.
The three ideas worth carrying with you: enterprise value is the takeover price of the entire business; EV-based multiples like EV/EBITDA compare companies more fairly than the P/E ratio because they neutralize debt; and a low EV multiple is only a bargain if the underlying business is sound. Combine enterprise value with the quality, growth, and momentum checks you already use, and you will spot mispriced stocks the crowd overlooks.
Try it yourself: Use Finance Halo's AI assistant to get instant analysis on any stock. Just type a ticker and ask for its enterprise value, EV/EBITDA, and how it stacks up against peers.
Disclaimer: This article is for educational purposes only and does not constitute investment advice. Always do your own research before making investment decisions.