What Is Cost-Push Inflation?
6/25/2026
Cost-push inflation is what happens when the cost of making things - oil, wages, memory chips, freight - climbs and businesses pass those higher costs straight to you, even as the economy slows. It is the harder, meaner kind of inflation, and in 2026 it is back.
What Is Cost-Push Inflation?
Cost-push inflation is a sustained rise in the general price level caused by an increase in the cost of production rather than an increase in demand. When the inputs a business needs - raw materials, energy, labor, components, shipping - get more expensive and there is no cheap substitute, firms protect their margins by raising the prices of the finished goods they sell. Because the cost increase hits a critical input that nearly every business uses, the price pressure spreads across the whole economy.
Economists frame it using aggregate supply and demand. In cost-push inflation, the aggregate supply curve shifts to the left: at every price level, companies are willing and able to produce less, because each unit now costs more to make. The result is the uncomfortable combination that defines this type of inflation - higher prices and lower output at the same time. Demand has not grown; the economy's ability to supply goods cheaply has shrunk.
A simple way to see the mechanism is the cost-plus pricing rule most firms actually use. A company sets its price by taking its unit cost and adding a target profit markup:
Here P is the selling price, C is the unit cost of production, and m is the desired markup. If C jumps because a key input got more expensive, the firm raises P just to keep the same markup m. Multiply that across millions of businesses facing the same input shock and you get economy-wide cost-push inflation - even if no consumer is spending a dollar more than before.
Cost-Push vs. Demand-Pull Inflation
The two engines of inflation are cost-push (supply-side) and demand-pull (demand-side). Demand-pull is the more familiar, friendlier version: "too many dollars chasing too few goods." A hot economy, rising wages, low rates, and confident consumers push demand above what the economy can supply, and prices rise. Crucially, demand-pull inflation usually arrives with strong growth and falling unemployment, so it is easier to live with and easier to fix.
Cost-push is the opposite temperament. It often arrives when growth is weak and unemployment is rising, because the very shock that lifts costs (an oil spike, a supply-chain break) also chokes off activity. That is why cost-push inflation is so closely tied to stagflation - stagnant growth plus inflation. Here is the head-to-head:
| Feature | Cost-Push Inflation | Demand-Pull Inflation |
|---|---|---|
| Root cause | Higher production costs (supply shock) | Excess demand for goods and services |
| Aggregate curve that moves | Supply shifts left | Demand shifts right |
| Effect on output | Output falls (recession risk) | Output rises (boom) |
| Effect on unemployment | Tends to rise | Tends to fall |
| Typical trigger | Oil, wages, materials, weak currency | Low rates, stimulus, strong confidence |
| Can the Fed fix it easily? | No - rate hikes hit demand, not supply | Yes - raise rates to cool demand |
| Classic example | 1970s oil shocks | Late-1960s boom; post-stimulus 2021 demand |
In the real world the two often blur together. A supply shock can kick off cost-push inflation, and if workers then win higher wages to keep up, demand-side pressure piles on top. The 2021-2023 episode was a textbook hybrid: pandemic supply-chain breaks and a semiconductor shortage (cost-push) collided with enormous fiscal stimulus and pent-up demand (demand-pull).
What Causes Cost-Push Inflation?
Cost-push inflation always traces back to a jump in some essential input cost. There are five usual suspects, and 2026 is serving up several of them at once.

1. Energy and commodity supply shocks
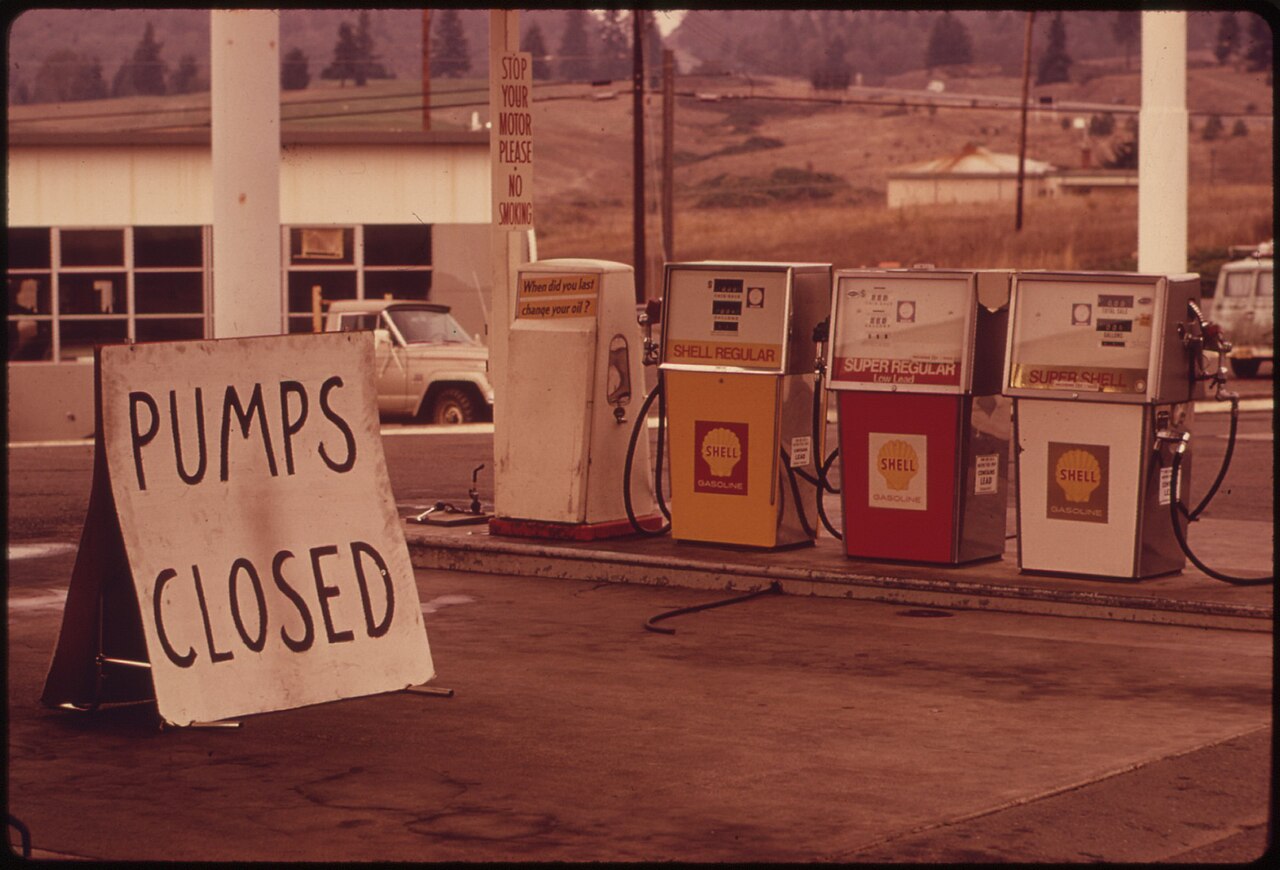
This is the heavyweight. Oil and natural gas feed into the cost of nearly everything - manufacturing, freight, plastics, fertilizer, electricity. When energy prices spike because of a war, an embargo, or a production cut, transport and input costs rise for every firm simultaneously. The 1970s oil embargoes are the canonical case, and they are why energy shocks are the first thing economists look at when prices jump.
2. Rising wages and labor costs
Labor is the largest single cost for most service businesses. When wages rise faster than productivity - because of tight labor markets, minimum-wage hikes, or union bargaining - firms face higher unit costs and pass them on. Wage-driven cost-push is especially sticky, because it can become self-reinforcing through the wage-price spiral (next section).
3. Raw materials and component shortages
When a critical component becomes scarce, its price soars and every downstream product gets more expensive. The 2021-2022 auto chip shortage is a perfect example: a shortage of cheap semiconductors raised car prices worldwide. In 2026, the input in short supply is memory (DRAM and NAND), as makers divert capacity to AI data centers and starve consumer devices.
4. A weaker currency (imported inflation)
For countries that import a lot, a falling currency makes every imported input more expensive in local terms - "imported inflation." A weaker dollar would raise the local-currency cost of oil and goods. Interestingly, in mid-2026 the dollar is strong, at a 13-month high, which actually cushions U.S. import costs even as other pressures build.
5. Taxes, tariffs, and regulation
Government can raise business costs directly. Tariffs on imported goods, higher corporate or payroll taxes, and costly new regulations all lift the cost of production, and a chunk typically lands in consumer prices. Tariffs are a clean example of policy-driven cost-push.
| Cause | How it raises costs | 2026 example |
|---|---|---|
| Energy shock | Fuel and electricity feed every supply chain | Oil spike lifting U.S. gasoline to a 3-year high |
| Wage growth | Higher labor cost per unit of output | Sticky service-sector wage pressure |
| Component shortage | Scarce input prices soar | Memory chip prices up to ~89% higher QoQ |
| Weak currency | Imports cost more in local money | (Muted - the dollar is at a 13-month high) |
| Tariffs and taxes | Policy adds directly to input cost | Trade-policy uncertainty on key goods |
The Wage-Price Spiral Explained
The most dangerous form of cost-push inflation is one that feeds itself - the wage-price spiral. It works as a loop:
- Prices rise because of an initial shock (say, oil).
- Workers see their real wages shrinking and demand higher pay to keep up.
- Employers grant raises, which increases their production costs.
- To protect margins, firms raise prices again.
- Higher prices erode real wages once more, and the loop repeats.
What makes the spiral so hard to break is inflation expectations. Once workers and businesses expect prices to keep rising, they bake those expectations into wage demands and price-setting in advance. Inflation becomes a self-fulfilling prophecy that persists long after the original shock has faded. This is exactly why central banks talk so much about "anchoring expectations" - if people stop believing inflation will come down, it becomes far more expensive to actually bring it down.
The 1970s showed how vicious this loop can be. The oil shock lit the fuse, but wage indexation and entrenched expectations kept inflation elevated for the better part of a decade, until the Volcker Fed crushed it with punishingly high interest rates and a deep recession.
Case Study: The 1970s Oil Shocks
If you want to understand cost-push inflation, study the 1970s. It is the cleanest large-scale example in modern history, and it is the playbook investors reach for whenever a supply shock hits.
In October 1973, in response to Western support for Israel in the Yom Kippur War, the Organization of Arab Petroleum Exporting Countries (OAPEC) launched an oil embargo against the United States and cut production. The price of a barrel of oil, which had been around $1.80 in 1970, was hiked to $11.65 by December 1973, according to the U.S. State Department's Office of the Historian - roughly a sixfold increase in a matter of months.
Because oil is woven into the cost of almost everything, that single input shock pushed up the price of most goods across the economy. The result was the word that came to define the decade: stagflation. The U.S. economy slid into the 1973-75 recession, during which real GDP fell about 3.2%, even as inflation stayed high. As the Federal Reserve History archive notes, the shock confronted policymakers with a brutal trade-off: fight inflation and deepen the recession, or support growth and let inflation run.
A second oil shock arrived in 1979 with the Iranian Revolution, roughly doubling oil prices again and re-igniting inflation. The lesson investors took away is durable: energy-driven cost-push inflation can coexist with a weak economy, and it punishes both stocks and bonds at the same time. That is why diversification into real assets matters so much in these episodes.
| Event | Approx. timing | Inflation impact |
|---|---|---|
| Pre-shock oil price | 1970 | ~$1.80 per barrel |
| OAPEC embargo and price hike | Oct-Dec 1973 | Oil to ~$11.65, ~6x jump |
| U.S. recession | 1973-75 | Real GDP fell ~3.2% |
| Second oil shock (Iran) | 1979 | Oil prices roughly doubled again |
Is 2026 a Cost-Push Moment?
Here is why this topic is not just history. Mid-2026 is flashing two simultaneous cost-push signals - one from energy, one from technology - and the inflation data is responding.
First, the data. The Fed's preferred gauge, the core PCE price index, rose 3.4% year-over-year in the May 2026 report released June 26, its highest reading since October 2023 and above the 3.3% economists expected. The headline PCE rate ran at 4.1%, the hottest since April 2023, with the jump driven partly by an oil and gasoline spike tied to the Iran conflict that left drivers paying the most for fuel in three years. That is textbook energy cost-push.
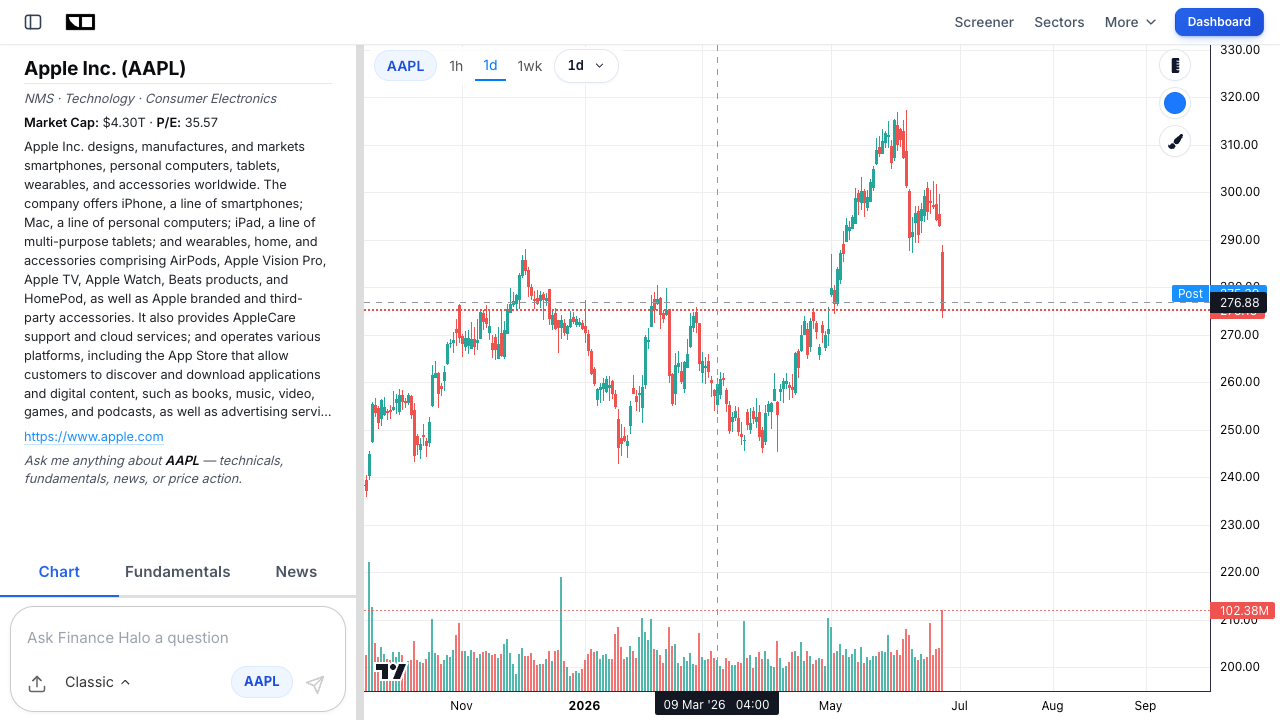
Second, the chip angle. A severe memory shortage has pushed DRAM prices up by as much as 89% quarter-over-quarter in Q2 2026, as manufacturers shift capacity from consumer chips toward high-margin AI memory. With memory now far more expensive, device makers are raising prices: Apple (AAPL) lifted Mac and iPad prices by up to $300, and Microsoft (MSFT) raised Xbox console prices by $100 to $150 effective August 1. Both companies pointed directly at memory costs. Apple shares fell about 6% on the news - a reminder that even mighty franchises take a hit when a cost shock squeezes margins.
The knock-on effects are spreading. Research firm IDC estimates average selling prices for new smartphones could rise as much as 8% in 2026, and PC prices by 4% to 8%, purely because of the memory crunch - even as unit sales fall. When a critical component gets scarce and pricier, and that cost flows straight into the products you buy, that is cost-push inflation in real time. You can ask Finance Halo's AI to break down any affected ticker, or analyze Micron (MU), the memory bellwether at the center of the squeeze.
Why Cost-Push Inflation Is the Fed's Nightmare
The Federal Reserve has exactly one set of tools - interest rates and the size of its balance sheet - and they all work by influencing demand. Raise rates, borrowing gets costly, spending and investment cool, and demand-pull inflation fades. That works beautifully when the problem is too much demand.
Cost-push inflation breaks that logic. The price pressure is coming from the supply side - a war, an embargo, a chip shortage - and no amount of rate hikes can drill more oil or build more fabs overnight. Worse, tightening into a supply shock cools an economy that is already weakening from the shock itself, raising the risk of recession without curing the inflation. That is the trap that produces stagflation, and it is why the Fed's balance-sheet and rate decisions become so fraught in these moments.
It puts the central bank in a genuine bind, with two bad options:
- Fight the inflation. Hike aggressively to crush demand and reset expectations - and risk turning a slowdown into a deep recession (the Volcker approach of the early 1980s).
- Support the economy. Hold or cut rates to protect jobs - and risk letting inflation expectations come unanchored, which makes the problem far worse later.
In 2026 the Fed under Chair Kevin Warsh has chosen the hawkish path, dropping its easing bias and talking tough on inflation. Markets have responded by pricing in a roughly 73% chance of a rate hike by September, lifting the dollar to a 13-month high and pushing gold below $4,000. If you want to see how the rate picture is shifting in real time, the Finance Halo market intelligence dashboard tracks the macro backdrop and sentiment daily.
How Cost-Push Inflation Hits Your Portfolio
Cost-push inflation is uniquely hard on a standard stock-and-bond portfolio, because it can hurt both sides at once - the exact scenario that broke the 60/40 portfolio in 2022.
Stocks get squeezed from two directions. Rising input costs compress profit margins, and the higher interest rates that often accompany inflation lower the present value of future earnings. That second effect hits long-duration growth and tech stocks hardest, because so much of their value sits in distant future cash flows. Bonds suffer too: inflation erodes the real value of fixed coupons, and rising rates push existing bond prices down. When inflation and recession fears combine, you can also see equity multiples compress and credit spreads widen - the kind of move that turns a pullback into a correction or bear market.
Sector leadership matters enormously here. Defensive and real-asset sectors tend to hold up, while rate-sensitive and discretionary sectors lag. Watching where money is actually rotating is one of the most useful tells in a cost-push regime.
Which Assets Win and Lose
No environment is uniformly bad for every asset. Cost-push inflation reshuffles the deck, rewarding the owners of scarce real things and punishing holders of long-dated paper promises. Here is the rough map:
| Tend to win | Why | Tend to lose | Why |
|---|---|---|---|
| Energy (XLE, oil producers) | Often the source of the shock - higher prices boost revenue | Long-duration growth/tech | Higher rates slash present value of future earnings |
| Commodities and materials | Real assets reprice up with input costs | Consumer discretionary | Squeezed wallets cut back on non-essentials |
| Consumer staples with pricing power | Can pass costs through; demand is inelastic | Low-margin retailers and airlines | Input costs hit razor-thin margins hardest |
| Gold and TIPS | Inflation hedges and stores of value | Long-dated fixed-rate bonds | Inflation erodes real value of fixed coupons |
| Value over growth | Near-term cash flows are less rate-sensitive | Highly leveraged firms | Rising rates raise refinancing costs |
The single most valuable trait a company can have in this environment is pricing power - the ability to raise prices without losing customers. A firm with a strong brand, a wide moat, or an essential product can pass higher input costs straight through to buyers and protect its margin. A commodity-style business with no differentiation has to eat the cost. This is why moaty staples and dominant franchises tend to outperform weak, undifferentiated competitors during a cost-push squeeze. For ideas on hedging the broader risk, see our guide on hedging a portfolio against geopolitical risk, since so many cost-push shocks are geopolitical in origin.
How to Position Your Portfolio
You cannot stop cost-push inflation, but you can tilt a portfolio to be more resilient to it. Here is a practical checklist you can act on today.
- Add a real-asset sleeve. A modest allocation to energy, broad commodities, or an inflation-protected bond fund (TIPS) gives you exposure that tends to rise with input costs.
- Favor pricing power. Screen for companies with high gross margins, strong brands, and pricing power rather than low-margin, commodity-style businesses that have to absorb cost increases.
- Shorten bond duration. If rates are likely to rise, shorter-maturity bonds and floating-rate instruments lose less value than long-dated fixed-rate bonds.
- Mind the sectors. Lean toward energy, materials, and defensive staples; be cautious on long-duration growth and rate-sensitive discretionary names. Our breakdown of which sectors win and lose when the Fed hikes maps neatly onto a cost-push regime.
- Keep some dry powder. Volatility creates opportunity. Cash that yields ~4% in a higher-rate world is no longer a drag, and it lets you buy quality on the dips.
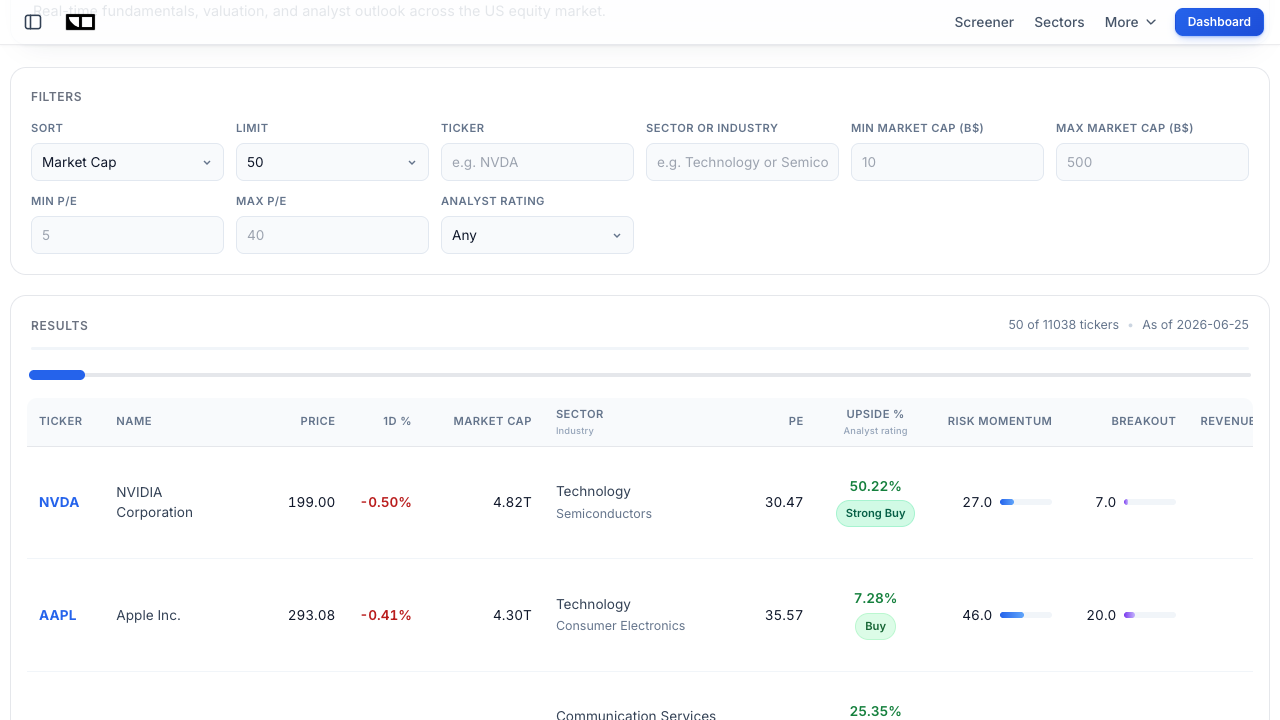
The fastest way to find pricing-power names is to screen for them directly. On the Finance Halo stock screener you can filter by sector, P/E range, and margins to surface high-quality companies that can defend their margins when costs rise.
Common Mistakes to Avoid
- Treating all inflation the same. Demand-pull and cost-push call for different playbooks. Buying rate-sensitive growth stocks because "stocks beat inflation" can backfire badly in a supply-shock regime. Diagnose the type first.
- Assuming the Fed can fix it fast. Rate hikes work on demand, not supply. Expecting a quick policy cure for an oil or chip shock leads to repeated disappointment and badly timed trades.
- Ignoring pricing power. Two companies in the same sector can fare very differently. The one that can raise prices keeps its margin; the one that cannot watches profits evaporate.
- Holding only long-duration bonds. Long-dated fixed-rate bonds are among the worst places to be when inflation and rates rise together. Many investors learn this the hard way.
- Forgetting real assets. A portfolio with zero exposure to energy, commodities, or inflation-protected securities has no natural hedge against a cost-push shock.
- Panic-selling everything. Cost-push regimes have clear relative winners. Wholesale liquidation locks in losses and misses the rotation into energy, staples, and real assets.
Frequently Asked Questions
What is cost-push inflation in simple terms?
It is when prices rise because the cost of making goods goes up - things like oil, wages, and components get more expensive, so businesses charge more. It is "supply-side" inflation, in contrast to demand-pull inflation, where prices rise because buyers are spending more.
What is the main cause of cost-push inflation?
The most powerful trigger is a supply shock, especially in energy. A spike in oil prices raises transport and production costs across the entire economy at once. Other causes include rising wages, raw-material or component shortages, a weaker currency, and higher taxes or tariffs.
How is cost-push inflation different from demand-pull inflation?
Cost-push comes from rising production costs and tends to arrive with weak growth and higher unemployment (the supply curve shifts left). Demand-pull comes from excess demand and usually arrives with a strong economy and falling unemployment (the demand curve shifts right). The Fed can cool demand-pull with rate hikes, but it cannot easily fix cost-push.
Is cost-push inflation the same as stagflation?
They are closely related but not identical. Stagflation is the combination of stagnant growth, high inflation, and rising unemployment. Cost-push inflation is a common cause of stagflation, because the same supply shock that raises prices also slows the economy. The 1970s oil shocks produced both at once.
Why can't the Federal Reserve stop cost-push inflation?
The Fed's tools - interest rates and its balance sheet - work by reducing demand. A supply shock raises prices regardless of demand, so hiking rates does not address the source. Worse, tightening into a supply shock can deepen a slowdown, which is why cost-push episodes put central banks in a difficult bind.
What investments do well during cost-push inflation?
Real assets and inflation hedges tend to outperform: energy stocks, broad commodities, gold, and inflation-protected bonds (TIPS). Companies with strong pricing power and defensive staples also hold up. Long-duration growth stocks and long-dated fixed-rate bonds tend to struggle.
Is the 2026 inflation cost-push or demand-pull?
It has strong cost-push features. An oil spike has lifted fuel costs, and a memory-chip shortage is forcing Apple, Microsoft, and others to raise hardware prices. Core PCE hit 3.4% in May 2026, its highest since 2023. These are supply-side pressures rather than a demand-driven boom.
Conclusion
Cost-push inflation is the inflation that arrives uninvited - born of an oil embargo, a chip shortage, a war, or a wage spiral, and capable of squeezing prices higher even as the economy cools. That is what makes it so dangerous for investors and so frustrating for the Fed, whose demand-cooling tools cannot drill more oil or build more memory fabs. The 1970s remain the defining lesson: a supply shock can punish stocks and bonds together and birth stagflation.
The encouraging news is that cost-push regimes are navigable. They reward the owners of real assets and businesses with genuine pricing power, and they punish long-duration paper promises. With core PCE at 3.4%, an oil-driven fuel spike, and memory costs forcing Apple and Microsoft to hike prices, 2026 is wearing the hallmarks of a cost-push moment. Tilt toward energy, commodities, inflation protection, and moaty companies that can defend their margins - and keep some dry powder for the volatility that always comes with it.
Try it yourself: Use Finance Halo's AI assistant to get instant analysis on any stock. Just type a ticker and ask whether it has the pricing power to thrive in a cost-push inflation environment.
Disclaimer: This article is for educational purposes only and does not constitute investment advice. Always do your own research before making investment decisions.