What Is Free Cash Flow (FCF)?
6/22/2026
Free cash flow (FCF) is the cash a business actually has left over after it pays to keep the lights on and invest in its future. Profit is an accounting opinion - free cash flow is the closest thing to a fact, and it is the number that ultimately funds dividends, buybacks, debt paydown, and your long-term returns.
What Is Free Cash Flow (FCF)?
Free cash flow (FCF) is the cash a company generates from its core operations after subtracting the money it spends on capital assets like factories, equipment, and technology. In plain English, it is the cash left over once a business has paid its bills and reinvested enough to keep running. That leftover cash is "free" because management can do anything it wants with it - pay a dividend, buy back stock, pay down debt, make an acquisition, or simply build a war chest.
The reason professional investors obsess over free cash flow is simple: it is the lifeblood of shareholder returns. A company cannot pay you a sustainable dividend or fund buybacks year after year out of accounting profit alone. It needs real cash. As legendary investor Warren Buffett and Amazon founder Jeff Bezos have both argued for decades, a share is ultimately worth the present value of the cash it will generate over its lifetime - not the earnings number printed at the top of a press release.
If you are new to reading financials, free cash flow pairs naturally with the basics in our guide on how to analyze a stock before buying. FCF is one of the most important numbers on that checklist.
Why "free" cash flow?
The word "free" trips up beginners. It does not mean the cash came at no cost. It means the cash is unencumbered - it is discretionary money the company has earned and is free to allocate. Two firms can report identical revenue and identical net income, yet one might gush free cash while the other quietly bleeds it because of heavy capital spending or ballooning inventory. The income statement hides that difference. The cash flow statement reveals it.
How to Calculate Free Cash Flow
There is no single line on a financial statement labeled "free cash flow" - you build it yourself from the cash flow statement. The good news is that the most common version takes just two numbers, both of which sit in the same place every public company files.
The simple FCF formula
The standard, back-of-the-envelope formula every investor should memorize is:
Operating cash flow (OCF) sits at the bottom of the "cash flow from operations" section. Capital expenditures (CapEx) - spending on property, plant, and equipment - sits in the "cash flow from investing" section, usually labeled "purchases of property and equipment." Subtract the second from the first and you have a clean estimate of free cash flow. Because both inputs come straight from the cash flow statement, this method is hard to game.
The detailed FCF formula (from net income)
Analysts building a discounted cash flow model often start higher up the income statement and work down to free cash flow to the firm (FCFF):
Here NOPAT is net operating profit after tax, "D and A" is depreciation and amortization added back because it is a non-cash expense, and the change in net working capital captures cash tied up in receivables and inventory. The result is the same concept as the simple formula - cash available after necessary reinvestment - just calculated with more precision for valuation work.
A worked mini-example
Imagine a company reports operating cash flow of $500 million and spends $120 million on new equipment during the year. Its free cash flow is:
That $380 million is the real cash the business produced for its owners and lenders. If the same company reported $450 million in net income, you would immediately notice that cash generation ($380M) trails reported profit - a small gap that is normal, but a gap worth watching if it widens over time.
Free Cash Flow vs Net Income: Why Cash Beats Earnings
This is the single most important reason to learn free cash flow. Net income is an accounting construct; free cash flow is closer to economic reality. Net income is built on accrual accounting, which records revenue when it is earned and expenses when they are incurred - not when cash actually moves. That gives management dozens of legitimate (and a few aggressive) choices about timing, depreciation schedules, and revenue recognition. As the old saying goes, "profit is an opinion, cash is a fact."
Free cash flow strips out most of those judgment calls. It does not care when a sale was "booked" - it cares when the cash hit the bank. That is why many seasoned investors treat FCF as a higher-quality signal than earnings per share. For the full picture on how earnings metrics work and where they fall short, see our breakdown of P/E ratio vs EPS vs PEG.
The FCF conversion ratio: a built-in lie detector
One of the most useful tricks in fundamental analysis is the FCF conversion ratio, which measures how much of reported profit turns into actual cash:
A healthy, high-quality business converts the bulk of its net income into free cash flow over a full cycle - a ratio near or above 1.0 is reassuring. When net income consistently and significantly exceeds free cash flow for several years, it can be a warning sign that a company is overstating its true earning power through aggressive accounting. If a firm keeps booking revenue from customers who are slow to pay (or never pay), you may see years of reported profit that the cash flow statement never confirms before the problem surfaces.
What FCF cannot tell you
Free cash flow is powerful but not perfect. A single year can be lumpy - a big tax payment, a one-time legal settlement, or the timing of a major capex project can distort it. That is why analysts look at FCF over three to five years and average out the noise. Cash flow is harder to fake than earnings, but it can still be managed in the short term (for example, by stretching out payments to suppliers), so always read the trend, not just one data point.
FCF vs Operating Cash Flow vs EBITDA
Free cash flow is one of several cash and profitability measures, and beginners often confuse them. Here is how the most common ones stack up.
| Metric | What it measures | Includes CapEx? | Best used for |
|---|---|---|---|
| Net Income | Accounting profit after all expenses, including non-cash ones | No (only depreciation) | Headline profitability, P/E ratio |
| EBITDA | Earnings before interest, taxes, depreciation, amortization | No | Comparing operating profitability across firms |
| Operating Cash Flow | Cash generated by core operations | No | Cash-generating ability before investment |
| Free Cash Flow | Operating cash flow after capital spending | Yes | Cash truly available to investors |
The crucial difference is that only free cash flow subtracts capital expenditures. EBITDA, in particular, flatters capital-intensive businesses because it ignores the very real cost of replacing equipment. That is exactly why Warren Buffett has mocked EBITDA - it pretends capex does not exist. To understand that critique in depth, read our guide on what EBITDA is and why Buffett calls it "bullshit earnings." Free cash flow closes that loophole by forcing capex back into the calculation.
FCF also feeds directly into enterprise-value multiples. Dividing a company's enterprise value by its free cash flow (EV/FCF) is one of the cleanest valuation ratios you can build, because it compares the total price of the business to the cash it actually throws off.
What Is a Good Free Cash Flow Yield?
Knowing a company's FCF in dollars is useful, but to compare opportunities you need to size it against price. That is what free cash flow yield does:
FCF yield tells you how much cash you are buying for every dollar you invest. It is the cash-flow cousin of the dividend yield, except it counts all the cash the company produces, not just the slice paid out as dividends. A 6% FCF yield means the business generates 6 cents of free cash per year for every dollar of its market value. The higher the yield, the cheaper you are paying for the underlying cash stream - all else equal.
Benchmarks: what counts as high?
As of mid-2026, the median US stock carries a free cash flow yield of roughly 4.7%. Anything meaningfully above that is generating a lot of cash relative to its price, and the market's cheapest cash machines yield far more. According to recent screens, the top names ranged from about 19.7% all the way up to 61.7% - four to thirteen times the median.
| FCF Yield Range | Interpretation |
|---|---|
| Below 2% | Expensive on a cash basis - the market is pricing in high growth |
| 2% - 5% | Roughly average; typical for steady large caps |
| 5% - 8% | Attractive cash generation, often a value signal |
| Above 8% | Cheap on cash - investigate why (cyclical peak? declining business?) |
A word of caution: a very high FCF yield is not automatically a bargain. Cyclical companies - energy producers, automakers, miners - often show their highest yields right at the top of their cycle, when cash flow is peaking and about to fall. For example, in mid-2026 screens, energy and automaker names like Ford (around 25.6%) and General Motors (around 24.0%) showed eye-popping yields precisely because the market doubted those cash flows would last. High yield is an invitation to dig deeper, not a buy signal on its own. This is the same trap covered in our beginner's guide to deep value stocks.
FCF Margin: How Much Revenue Becomes Cash?
Where FCF yield compares cash to price, FCF margin compares cash to sales. It answers a different question: of every dollar of revenue, how many cents end up as free cash flow?
FCF margin is a powerful quality screen because it rewards efficient, capital-light business models. Software companies, payment networks, and brand-driven consumer franchises often convert 20% to 40% (or more) of revenue into free cash, while capital-heavy industries - airlines, telecoms, automakers - run in the low single digits. A consistently high and rising FCF margin is one of the clearest fingerprints of a durable competitive advantage.
- Above 20%: Exceptional - usually an asset-light, high-margin franchise.
- 10% - 20%: Strong cash conversion, typical of quality compounders.
- 5% - 10%: Solid but more capital-intensive.
- Below 5%: Thin - common in heavy-industry or fast-reinvestment models.
Levered vs Unlevered Free Cash Flow
As you go deeper, you will meet two flavors of FCF, and the distinction matters for valuation.
Unlevered free cash flow (FCFF)
Unlevered free cash flow, also called free cash flow to the firm (FCFF), is the cash a business produces before any payments to lenders. It ignores the company's debt structure entirely, which makes it ideal for comparing two businesses on an apples-to-apples basis and for building enterprise-value-based valuations.
Levered free cash flow (FCFE)
Levered free cash flow, or free cash flow to equity (FCFE), is what remains after interest and mandatory debt payments. It is the cash that genuinely belongs to shareholders, so it is the right number when you want to know what can fund dividends and buybacks. The more debt a company carries, the bigger the gap between its unlevered and levered free cash flow.
| Unlevered FCF (FCFF) | Levered FCF (FCFE) | |
|---|---|---|
| Before or after debt? | Before interest and debt payments | After interest and debt payments |
| Belongs to | All capital providers (debt + equity) | Equity holders only |
| Paired with | Enterprise value | Market cap / equity value |
| Best for | Comparing firms, DCF valuation | Assessing dividend/buyback capacity |
Why Free Cash Flow Matters to Investors
Free cash flow is not an academic curiosity - it is the engine behind nearly everything that makes you money as a shareholder. A company with strong, growing FCF has options. A company without it is dependent on the kindness of capital markets. Here is what abundant free cash flow actually pays for:
- Dividends: Sustainable dividends come from free cash flow, not borrowing. If a firm's dividend exceeds its FCF for long, a cut is coming.
- Share buybacks: Repurchases that shrink the share count and lift earnings per share need real cash to fund them.
- Debt reduction: Paying down debt with FCF de-risks the balance sheet and is especially valuable when interest rates are high.
- Acquisitions and growth: Self-funded expansion avoids dilution and the cost of new debt.
- Resilience: Cash-rich companies survive recessions and can go on offense while rivals retrench.
This is why free cash flow sits at the heart of valuation. The entire framework of a discounted cash flow (DCF) model rests on projecting a company's future free cash flows and discounting them back to today. When you hear an analyst talk about a stock's "intrinsic value," they are almost always talking about the present value of future free cash flow.
Real-World Example: Apple vs Amazon
Nothing makes free cash flow click like comparing two giants with opposite cash profiles. Let us look at Apple (AAPL) and Amazon (AMZN) using their most recent figures.
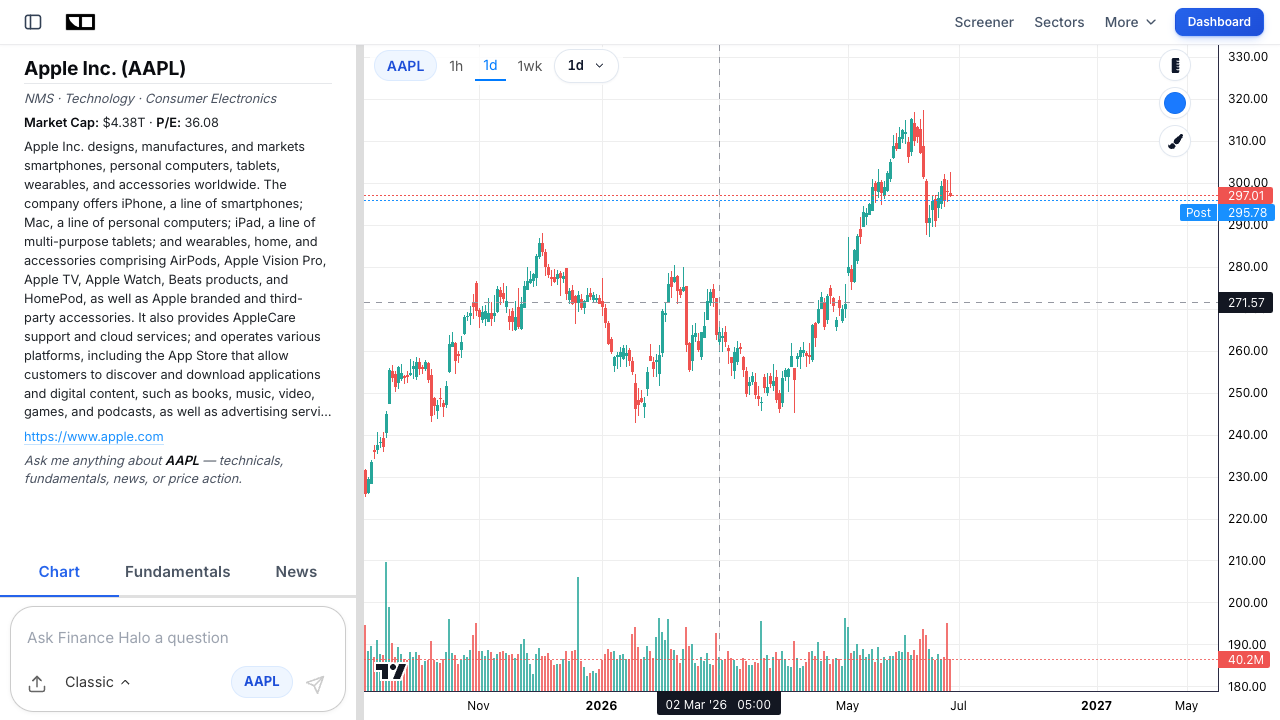
Apple: a free cash flow machine
Apple is the textbook cash cow. In fiscal 2025, Apple generated roughly $98.8 billion in free cash flow (about $98.767 billion), even though that was down about 9.2% from the prior year. Apple's model is capital-light - it outsources most manufacturing, so its capital expenditures are tiny relative to the cash its products and services throw off. The result is enormous free cash flow that funds one of the largest dividend-and-buyback programs in history. When you see a company convert that much operating cash into FCF with so little capex, you are looking at a business with a deep moat and pricing power.
Amazon: cash plowed back into growth
Amazon tells the opposite story - and it is a perfect lesson in why context matters. In its most recent fiscal year, Amazon produced operating cash flow of roughly $139.5 billion, even more than Apple's. Yet its free cash flow collapsed to around $11.2 billion, down from about $38.2 billion a year earlier. Why? Because Amazon spent roughly $128.3 billion on capital expenditures - data centers, warehouses, and AI infrastructure - and management has guided capex up toward $200 billion in 2026, nearly 60% higher.
Is low free cash flow a problem for Amazon? Not necessarily. This is exactly the philosophy Jeff Bezos laid out in his 2004 letter to shareholders: "earnings don't directly translate into cash flows, and shares are worth only the present value of their future cash flows." Bezos deliberately suppressed near-term free cash flow to invest in long-term cash-generating assets. The key question for an investor is whether that spending will earn a strong return. If it does, today's depressed FCF becomes tomorrow's gusher. If it does not, the company has simply burned cash. That judgment - growth investment versus value destruction - is the heart of analyzing free cash flow.
| Metric (most recent FY) | Apple (AAPL) | Amazon (AMZN) |
|---|---|---|
| Operating cash flow | Very high, low capex | ~$139.5 billion |
| Capital expenditures | Light (asset-light model) | ~$128.3 billion |
| Free cash flow | ~$98.8 billion | ~$11.2 billion |
| FCF story | Mature cash cow, big buybacks | Cash reinvested for growth |
How to Screen for High Free Cash Flow Stocks
Once you understand free cash flow, the natural next step is finding companies that excel at it. You can do this systematically with a screener rather than checking stocks one by one.
Here is a practical, repeatable workflow:
- Start with the cash flow statement, not the income statement. Pull up operating cash flow and capex, and confirm the company actually generates positive FCF.
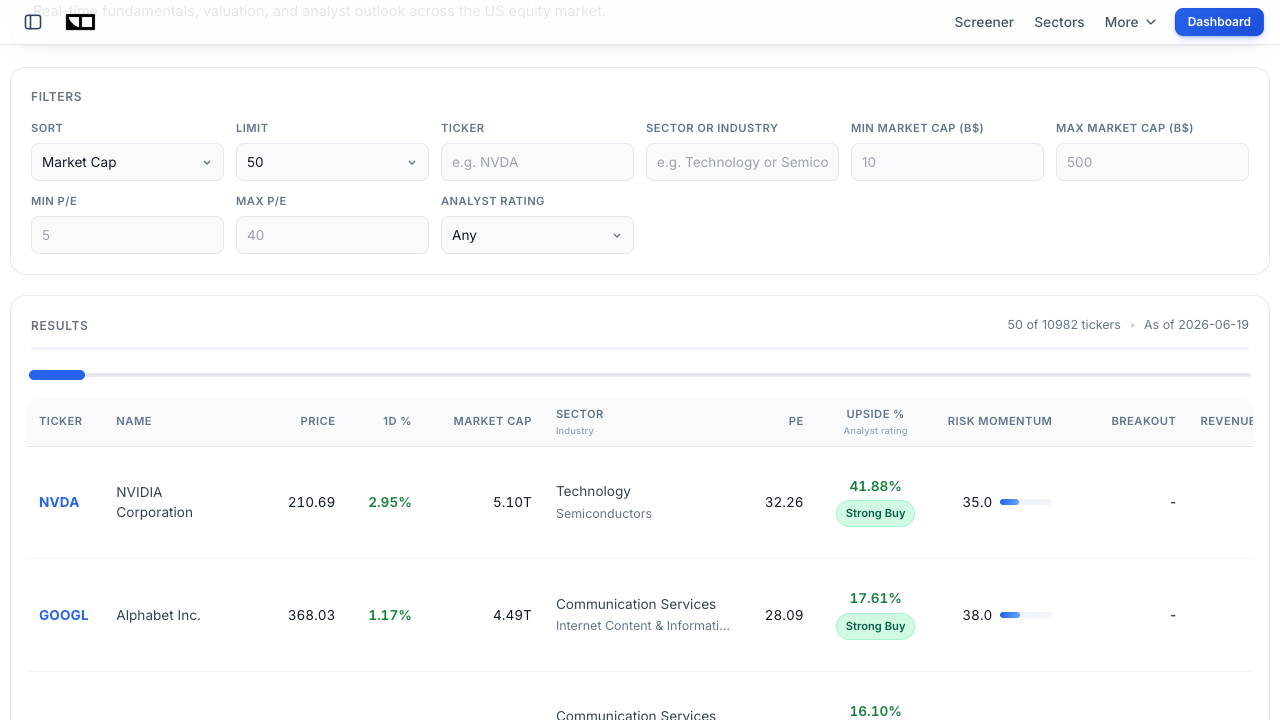
- Check the FCF yield against price. Use the Finance Halo screener to filter by valuation and sector, then compare each candidate's cash generation to its market cap.
- Demand consistency. Look for three to five straight years of positive and ideally rising free cash flow. One good year can be luck; five is a pattern.
- Compare FCF to net income. A conversion ratio near or above 1.0 over time signals clean earnings quality.
- Cross-check with quality scores. The Finance Halo stock-score screener ranks names by proprietary signals including a Deep Value score that rewards cash generation relative to price.
For the bigger macro picture - which sectors are generating the most cash and where the market is rotating - the Finance Halo market intelligence dashboard pulls it together in one daily AI-generated report.
Common Mistakes to Avoid
Free cash flow is a sharp tool, but it cuts both ways if you misuse it. Watch out for these traps:
- Treating one bad year as a trend. A single year of weak or negative FCF can reflect a one-time capex project, a tax timing issue, or a working-capital swing. Always look at three to five years before judging.
- Ignoring why FCF is negative. Negative free cash flow at a high-return growth company (think early Amazon) is very different from negative FCF at a declining business burning cash to survive. Context is everything.
- Chasing a sky-high FCF yield blindly. Cyclical peaks and structurally declining businesses both produce tempting yields. Ask whether the cash flow is sustainable before buying.
- Confusing operating cash flow with free cash flow. A company can have huge operating cash flow and almost no FCF if its capex is enormous. Always subtract capital expenditures.
- Forgetting stock-based compensation. Many tech firms report flattering FCF while diluting shareholders through heavy stock comp. Adjust for it, especially with high-growth names.
- Using FCF in isolation. Pair it with valuation (P/E, EV/FCF), balance-sheet health, and growth. No single metric tells the whole story - see our guide to what a good P/E ratio is for the valuation side.
Frequently Asked Questions
What is free cash flow in simple terms?
Free cash flow is the cash a company has left over after paying for its day-to-day operations and the capital investments needed to maintain and grow the business. It is the discretionary cash management can use for dividends, buybacks, debt repayment, or acquisitions.
How do you calculate free cash flow?
The simplest formula is operating cash flow minus capital expenditures, both taken directly from the cash flow statement. For valuation work, analysts also calculate free cash flow to the firm starting from net operating profit after tax, adding back depreciation, and subtracting changes in working capital and capex.
Is free cash flow better than net income?
For judging real financial health, many investors prefer free cash flow because it is harder to manipulate than net income. Net income relies on accrual accounting choices, while FCF tracks actual cash. The best practice is to use both and watch for large, persistent gaps between them.
What is a good free cash flow yield?
As a rough guide, a free cash flow yield above the market median of roughly 4.7% is attractive, and yields of 5% to 8% often signal value. Yields above 8% deserve scrutiny because they can reflect a cyclical peak or a declining business rather than a true bargain.
Can free cash flow be negative?
Yes. A company can report negative free cash flow if it spends more on operations and capital investments than it brings in. This is a warning sign for a mature company but can be perfectly healthy for a young, fast-growing one reinvesting in high-return projects.
What is the difference between free cash flow and EBITDA?
EBITDA measures operating profitability before interest, taxes, depreciation, and amortization, and it ignores capital expenditures entirely. Free cash flow subtracts capex, so it reflects the real cash a capital-intensive business has left. FCF is the more conservative and complete measure.
Why do investors care so much about free cash flow?
Because free cash flow funds everything that rewards shareholders - dividends, buybacks, debt paydown, and growth - and it is the foundation of intrinsic-value calculations through discounted cash flow models. Strong, growing FCF is one of the most reliable markers of a high-quality business.
Where do I find a company's free cash flow?
Look at the cash flow statement in a company's 10-K or 10-Q filing. Take the operating cash flow figure and subtract capital expenditures (often listed as "purchases of property and equipment"). Many data providers and screeners, including Finance Halo, surface these figures for you.
Conclusion
Free cash flow is the closest thing investing has to a truth serum. Where net income can be shaped by accounting choices, free cash flow measures the actual cash a business produces after keeping itself running - the cash that funds your dividends, your buybacks, and ultimately your returns. Master three quick checks and you will be ahead of most retail investors: calculate FCF as operating cash flow minus capex, size it up with FCF yield and FCF margin, and compare it to net income to gauge earnings quality.
Remember the two lessons from Apple and Amazon. High free cash flow, as at Apple, signals a mature, moat-protected cash machine. Low or negative free cash flow, as at Amazon, can be a deliberate bet on future growth - or a red flag - depending entirely on the return those investments earn. Your job is to tell the difference. Combine free cash flow with valuation, the balance sheet, and a multi-year trend, and you will own a complete, durable framework for finding quality businesses at fair prices.
Try it yourself: Use Finance Halo's AI assistant to get instant analysis on any stock. Just type a ticker and ask about its free cash flow, FCF yield, or cash-generation trend.
Disclaimer: This article is for educational purposes only and does not constitute investment advice. Always do your own research before making investment decisions.