What Is a Good P/B Ratio? (By Industry)
6/21/2026
A "good" P/B ratio is one of the most misunderstood numbers in investing. A price-to-book ratio of 1.5 can be expensive for a bank and absurdly cheap for a software company. This guide shows you what a good P/B ratio actually looks like, broken down by industry, with 2026 benchmarks you can use today.
What Is the Price-to-Book (P/B) Ratio?
The price-to-book ratio (P/B), sometimes called the market-to-book ratio, measures how the stock market values a company relative to the accounting value of its net assets. In plain English, it answers a simple question: for every dollar of equity sitting on the balance sheet, how many dollars are investors willing to pay?
"Book value" is what would theoretically be left for shareholders if the company sold all its assets and paid off all its debts. It is the equity line on the balance sheet: total assets minus total liabilities. The P/B ratio takes the market's price for that equity and divides it by the accounting value of that equity.
A few quick reference points to anchor your intuition:
- P/B below 1.0: the market values the company at less than its stated net assets. This can signal a bargain, distress, or assets that the market thinks are overstated.
- P/B equal to 1.0: the price exactly matches book value. You are paying "par" for the balance sheet.
- P/B above 1.0: the market is paying a premium to book, usually because the company earns high returns on its equity or owns valuable intangibles the balance sheet ignores.
The metric has deep roots in value investing. It is one of the cornerstone tools taught in the classic playbook for finding deep value stocks, and it pairs naturally with the more famous price-to-earnings (P/E) ratio when you are sizing up whether a stock is cheap or expensive.
How Do You Calculate the P/B Ratio?
The P/B formula is refreshingly simple. There are two equivalent ways to express it, depending on whether you work per share or with totals.
Or, equivalently, using company-wide totals:
Step 1: Find book value per share
Book value per share (BVPS) is the foundation. You pull total shareholders' equity from the balance sheet and divide by the number of shares outstanding:
Total assets minus total liabilities is simply total shareholders' equity, so you can also read that number straight off the balance sheet and divide by share count.
Step 2: A worked example
Imagine a hypothetical bank, "BankCo," with $200 billion in total assets and $180 billion in total liabilities. Its shareholders' equity is $20 billion. If BankCo has 1 billion shares outstanding, its book value per share is $20.
Now suppose the stock trades at $24 per share. The P/B ratio is:
A P/B of 1.2 means investors are paying a 20% premium to the bank's net asset value, a perfectly normal valuation for a healthy, profitable bank. If that same stock fell to $16, its P/B would drop to 0.8, meaning the market values it at a 20% discount to book, the kind of reading that makes value investors take a closer look. Knowing how to pull these inputs from a financial statement is a core part of learning how to analyze a stock before buying.
What Is a "Good" P/B Ratio?
Here is the honest answer most articles dodge: "good" depends entirely on context. But there are some widely used rules of thumb worth knowing, as long as you treat them as starting points rather than gospel.
The most common rule says a P/B ratio under 1.0 may indicate an undervalued stock, while a ratio above 3.0 is often considered expensive. The legendary value investor Benjamin Graham was even stricter. In The Intelligent Investor, his defensive criteria called for a P/B ratio no higher than 1.5, combined with a P/E no higher than 15.

Graham went further and combined the two limits into a single number now called the Graham Number, the maximum price a defensive investor should pay:
The 22.5 comes directly from multiplying his two ceilings (15 P/E times 1.5 P/B). It is a useful sanity check, but it was designed in the 1930s-1970s for an industrial economy. Apply Graham's 1.5 limit to the modern market and you will screen out almost every technology, consumer, and healthcare company, not because they are overpriced, but because their value lives in intangibles the balance sheet never records.
The single most important takeaway is this: a "good" P/B ratio is one that is low relative to the company's own industry and its own history, and that is backed by a strong return on equity. A bank at 0.9x book is interesting. A semiconductor stock at 0.9x book is a flashing red warning light.
Why a "Good" P/B Ratio Depends on the Industry
The reason P/B benchmarks vary so wildly across sectors comes down to one thing: how much of a company's real value shows up on its balance sheet.
Book value is an accounting measure. It captures tangible, recorded assets reasonably well: cash, loans, buildings, inventory, machinery, and securities. It does a terrible job of capturing intangible value: brands, patents, software code, network effects, customer relationships, and human capital. Accounting rules generally do not let a company record the value of a brand it built internally, even when that brand is worth tens of billions.
That creates two very different worlds:
- Asset-heavy businesses (banks, insurers, REITs, utilities, autos, airlines, basic materials) hold mostly tangible assets. Their book value is close to their real economic value, so P/B is a meaningful, reliable yardstick. Benchmarks cluster near 1x to 2x.
- Asset-light businesses (software, semiconductors, pharmaceuticals, consumer brands, internet platforms) derive most of their worth from intangibles that never hit the balance sheet. Their book value drastically understates reality, so P/B ratios are structurally high, sometimes 10x or more, and comparisons to "1.0" are meaningless.
This is exactly why you should never compare a bank's P/B to a chipmaker's P/B. They are measuring different things. The right move is always to compare a company against its sector peers, the same discipline you apply when judging a good price-to-sales ratio by industry.
P/B Ratio by Industry: A 2026 Benchmark Table
So what does "normal" actually look like? The table below shows average price-to-book ratios by US sector as of January 2026, drawn from NYU professor Aswath Damodaran's industry dataset. For perspective, the total US market traded at roughly 4.6x book, and the S&P 500 sat near 5.4x, well above its long-term average of about 3.9x.
| Industry / Sector | Avg. P/B (Jan 2026) | Asset profile |
|---|---|---|
| Real Estate (general/diversified) | 1.16 | Asset-heavy |
| Banks (regional) | 1.14 | Asset-heavy |
| Insurance (life) | 1.43 | Asset-heavy |
| Banks (money center) | 1.62 | Asset-heavy |
| Oil & Gas (integrated) | 1.71 | Asset-heavy |
| Utilities (general) | 1.81 | Asset-heavy |
| REITs | 1.99 | Asset-heavy |
| Insurance (general) | 3.45 | Mixed |
| Retail (general) | 7.19 | Asset-light |
| Auto & Truck | 7.72 | Mixed/brand-heavy |
| Software (system & application) | 9.14 | Asset-light |
| Semiconductors | 13.31 | Asset-light |
Look at the spread. A P/B of 1.5 would be slightly rich for a regional bank but would represent a once-in-a-generation bargain for a semiconductor company averaging 13x. This single table is the antidote to the lazy "P/B under 1 is cheap" advice. A handful of practical reads:
- Financials and real estate (banks, insurers, REITs) sit in the 1x to 2x range. Here, P/B is your primary valuation tool and a sub-1x reading genuinely matters.
- Energy, utilities, and industrials typically run 1.5x to 3x. P/B is useful but should be paired with cash-flow metrics.
- Tech, software, and semiconductors routinely trade above 8x to 13x. Here P/B is mostly noise; lean on P/E, growth, and the PEG ratio instead.
Why P/B Means Nothing Without ROE
If you remember one advanced idea from this article, make it this one: the P/B ratio and return on equity (ROE) are two sides of the same coin. You should never look at one without the other.
ROE measures how much profit a company generates on each dollar of book equity. A company that earns a 25% ROE is creating far more value per dollar of book than one earning 5%, so the market rationally pays a higher multiple of book for it. In a simplified dividend-growth framework, the "justified" P/B ratio a company deserves is driven directly by its ROE:
where g is the sustainable growth rate and r is the cost of equity. The intuition matters more than the math: when ROE is greater than the cost of equity, the company deserves a P/B above 1.0. When ROE is below the cost of equity, it deserves a P/B below 1.0, because it is destroying value on each retained dollar.
This is why a "cheap" low-P/B stock can be a trap. Consider two banks:
| Metric | Bank A (the trap) | Bank B (the bargain) |
|---|---|---|
| P/B ratio | 0.6 | 1.3 |
| Return on equity (ROE) | 4% | 17% |
| What it tells you | Cheap for a reason: poor returns, possible loan losses | Premium earned by strong, durable profitability |
Bank A looks like a steal at 0.6x book, but a 4% ROE means it is barely earning its keep. Bank B, at more than double the multiple, may be the genuinely better investment because its 17% ROE compounds book value quickly. The rule: low P/B plus high ROE is the real bargain; low P/B plus low ROE is usually a warning.
P/B vs P/E vs P/S: When Should You Use Each?
The P/B ratio is one tool in a kit, not a standalone verdict. Each valuation multiple shines in different situations. Here is a quick decision guide:
| Multiple | What it compares | Best used for | Weak spot |
|---|---|---|---|
| P/B (Price / Book) | Price vs net assets | Banks, insurers, REITs, asset-heavy firms; distressed or cyclical bottoms | Useless for asset-light tech; ignores intangibles |
| P/E (Price / Earnings) | Price vs profit | Stable, profitable companies across most sectors | Breaks down for unprofitable or highly cyclical firms |
| P/S (Price / Sales) | Price vs revenue | High-growth or money-losing companies with no earnings yet | Ignores profitability entirely |
A practical workflow is to start with P/B for financials and asset-heavy names, lean on P/E for mature profitable businesses, and fall back to P/S for fast-growing companies that have not turned a profit. For a deeper walkthrough of how the earnings-based metrics stack up, see our full breakdown of P/E vs EPS vs PEG, and for cash-flow-aware valuation, the guide to enterprise value (EV). The pros rarely rely on a single multiple; they triangulate.
Real-World Example: Three Stocks, Three Stories
Let's put the theory to work with three real, well-known companies that show how differently P/B behaves across business models. (Figures are directional sector reads as of mid-2026, meant to illustrate the framework, not to serve as live quotes.)
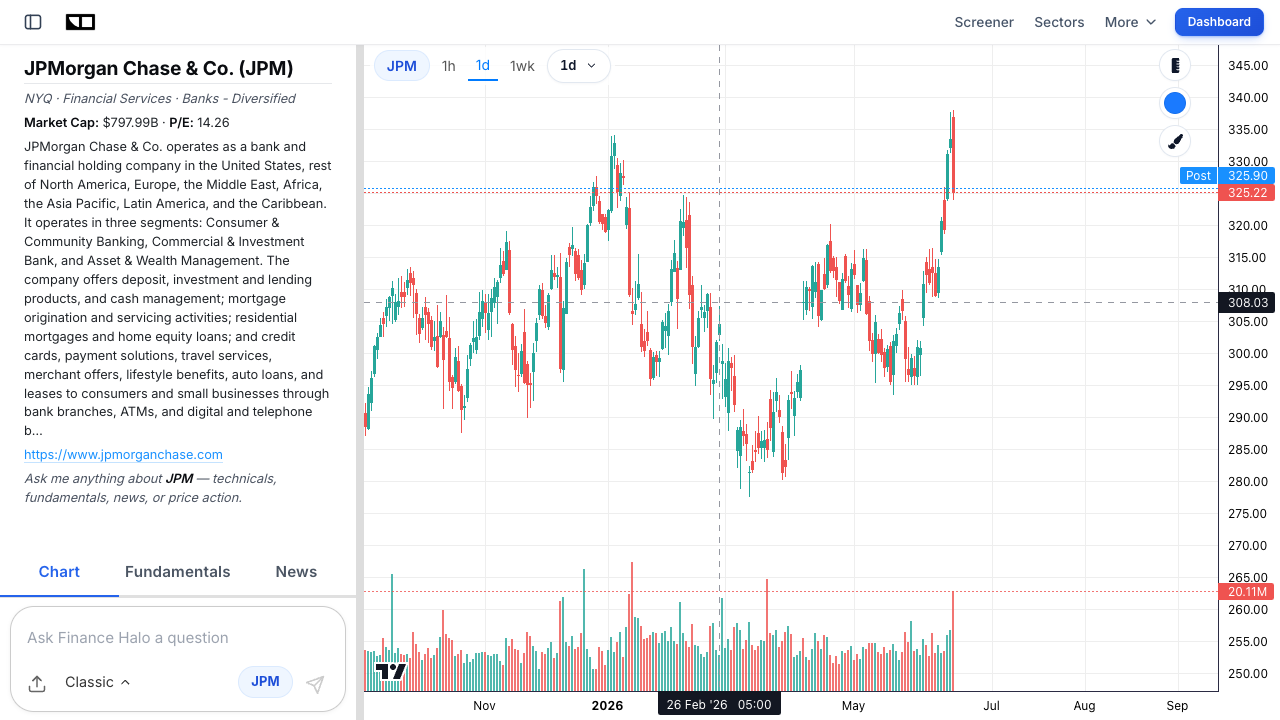
1. JPMorgan Chase (JPM): a premium-priced bank
JPMorgan Chase (JPM) is the gold standard of US banking. Because it is a bank, its book value is meaningful, and because it consistently posts high returns on equity, the market rewards it with a P/B comfortably above the money-center average of 1.62. That premium is not irrational, it is the ROE-to-P/B relationship in action: a bank that compounds equity at a mid-to-high teens ROE deserves to trade above book.
2. Citigroup (C): the perennial "below book" debate
Citigroup (C) has spent much of the last decade trading at or below its book value, a textbook low-P/B situation. The bull case is obvious: you are buying a global bank for less than its stated net worth. The bear case is the value-trap risk: a discount to book often reflects a structurally lower ROE and lingering doubts about asset quality. Citigroup is the perfect illustration that a sub-1x P/B is the start of an investigation, not the end of one.
3. NVIDIA (NVDA): where P/B stops working
Now look at NVIDIA (NVDA). With the semiconductor sector averaging a P/B above 13, and NVIDIA's value resting almost entirely on intellectual property, design talent, and software ecosystems, its book value captures only a sliver of what the company is actually worth. Judging NVIDIA on P/B would tell you it is "wildly overvalued" at virtually all times, a verdict that has been spectacularly wrong for years. For a name like this, P/B is the wrong tool; earnings, growth, and cash flow do the heavy lifting.
The lesson across all three: the same P/B number carries opposite meanings depending on the business. Context, sector, and ROE turn a raw ratio into an actual insight. You can pull the live P/B, ROE, and valuation picture for any of these names instantly by asking the Finance Halo AI assistant.
The Limitations of the P/B Ratio
P/B is powerful in the right setting, but it has real blind spots. Understanding them keeps you from misreading the number.
It ignores intangible assets
This is the big one. Brands, patents, software, and network effects are often a company's most valuable assets, yet internally generated intangibles rarely appear on the balance sheet. For modern, intangible-rich businesses, book value is a poor proxy for true value, which is why their P/B ratios look "expensive" by old-school standards.
Buybacks and goodwill distort book value
When a company buys back stock at a price above book value, it mechanically reduces shareholders' equity, which pushes the P/B ratio higher even though the company may be creating value per share. Conversely, acquisitions can inflate equity with goodwill, an intangible that can later be written off in a big impairment, suddenly slashing book value. Both effects mean reported book value is not always "clean."
Negative book value breaks the ratio entirely
Some highly profitable, buyback-heavy companies have driven their book value negative. When equity is negative, the P/B ratio becomes meaningless (you cannot meaningfully divide by a negative book). The metric simply does not apply to these firms.
The fix: tangible book value (P/TBV)
For banks, insurers, and acquisitive companies, analysts often switch to price-to-tangible-book-value (P/TBV), which strips out goodwill and other intangibles to show the hard, loss-absorbing equity. It is a stricter, cleaner version of P/B and is the preferred measure across most of the financial sector.
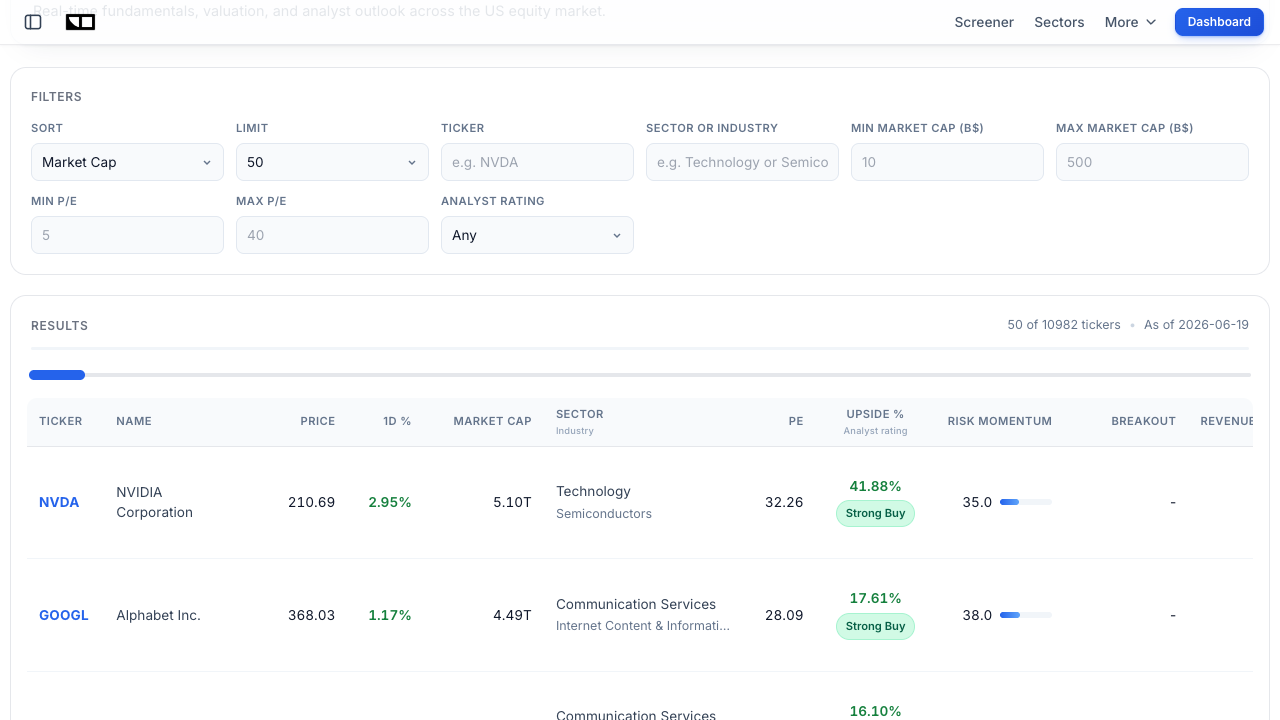
How to Screen for Stocks by P/B Ratio
Knowing the theory is one thing; finding the actual stocks is another. Here is a practical, repeatable process for putting P/B to work.
- Start within one sector. Never screen P/B across the whole market. Pick a sector where book value matters (financials, REITs, utilities, energy, industrials) and rank names against their peers.
- Pair P/B with ROE. Filter for stocks with a below-average P/B and an above-average ROE. That combination, cheap relative to assets but still profitable, is where genuine bargains hide.
- Check the trend in book value. Rising book value per share over time signals a company compounding equity; falling BVPS can signal losses or aggressive buybacks.
- Confirm with a second metric. Cross-check against P/E or free cash flow so you are not buying a value trap.
You can run exactly this kind of screen on the Finance Halo Market Screener, filtering by sector, market cap, and valuation metrics to surface candidates in seconds. For a more quantitative edge, the Stock Scores Screener ranks stocks by a proprietary Deep Value score that blends P/B with other balance-sheet and valuation signals, so you are not relying on a single ratio in isolation. Pair the output with the daily macro read on the Market Intelligence Dashboard to time your entries with the broader regime.
Common P/B Ratio Mistakes to Avoid
- Comparing across industries: judging a software stock's 9x P/B against a bank's 1.2x is meaningless. Always compare within the same sector.
- Treating "below 1.0" as an automatic buy: a sub-1x P/B often reflects real problems (weak ROE, asset write-downs, dying business). Investigate why it is cheap.
- Ignoring ROE: P/B without return on equity is half a picture. Low P/B plus low ROE is usually a trap, not a gift.
- Applying P/B to asset-light businesses: for tech, pharma, and brands, book value misses most of the value. Use P/E, PEG, or cash-flow multiples instead.
- Forgetting about goodwill and buybacks: reported book value can be inflated by goodwill or distorted by repurchases. Use tangible book value for financials.
- Using a single snapshot: one quarter's P/B tells you little. Compare it to the company's own multi-year history and its sector average.
Frequently Asked Questions
Is a P/B ratio under 1 always a good buy?
No. A P/B below 1.0 means the market values the company at less than its net assets, which can signal a bargain, but it just as often signals trouble: weak profitability, declining assets, or a dying business model. A low P/B is a reason to investigate, not an automatic buy. Always check whether the company's return on equity justifies a higher multiple.
What is a good P/B ratio for a bank?
For banks, a P/B in the range of roughly 1.0x to 1.5x is typical for a healthy, profitable institution, with regional banks averaging about 1.14 and money-center banks around 1.62 as of early 2026. The strongest, highest-ROE banks trade above 2x, while troubled banks can fall well below book. Many analysts prefer price-to-tangible-book-value (P/TBV) for banks because it strips out goodwill.
Why do tech companies have such high P/B ratios?
Because their most valuable assets, software, patents, brands, and network effects, are intangibles that accounting rules largely keep off the balance sheet. That makes book value a poor measure of a tech company's real worth, so its P/B ratio looks structurally high. For asset-light businesses, P/E and growth-adjusted metrics are far more useful than P/B.
What is the difference between P/B and P/TBV?
P/B uses total book value (shareholders' equity), while price-to-tangible-book-value (P/TBV) removes goodwill and other intangible assets first. P/TBV is stricter and gives a cleaner view of the hard, loss-absorbing equity, which is why it is the go-to measure for banks, insurers, and companies that have grown through acquisitions.
How is the P/B ratio related to ROE?
Closely. Return on equity drives the P/B a company deserves: when ROE exceeds the cost of equity, the firm should trade above book value; when ROE is below it, the firm should trade below book. That is why a low-P/B, high-ROE stock is the classic bargain setup, while a low-P/B, low-ROE stock is usually a value trap.
Can the P/B ratio be negative?
The ratio itself is rarely shown as negative; instead, it becomes meaningless when a company has negative shareholders' equity (often caused by sustained losses or heavy debt-funded buybacks). With negative book value, the denominator breaks and P/B no longer applies. In those cases, lean on earnings, cash flow, or enterprise-value multiples.
What P/B ratio does the overall stock market trade at?
As of January 2026, the S&P 500 traded at roughly 5.4x book value and the total US market near 4.6x, both well above the long-run historical average of about 3.9x. These market-wide figures are inflated by large, intangible-heavy technology companies, which is another reminder to judge P/B sector by sector rather than against a single market number.
Conclusion
So, what is a good P/B ratio? The only honest answer is: it depends on the industry, the company's return on equity, and its own history. A price-to-book ratio of 1.2 is healthy for a bank, expensive for a regional lender with weak ROE, and a fantasy-level bargain for a semiconductor firm that normally trades at 13x book. The number means nothing in isolation.
To use P/B well, remember the three rules that run through this entire guide. First, always compare within the same sector, using benchmarks like the 2026 table above rather than a one-size-fits-all "under 1.0 is cheap." Second, never read P/B without ROE, because a low multiple is only a bargain when the company still earns strong returns on its equity. Third, know when to put P/B away entirely, since for asset-light tech and brands, book value misses the whole story and earnings-based metrics do the real work. Get those three habits right and the price-to-book ratio becomes one of the sharpest tools for spotting genuinely undervalued, high-quality stocks.
Try it yourself: Use Finance Halo's AI assistant to get instant analysis on any stock. Just type a ticker and ask for its P/B ratio, ROE, and how it compares to its sector.
Disclaimer: This article is for educational purposes only and does not constitute investment advice. Always do your own research before making investment decisions.