What Is Average True Range (ATR)?
6/12/2026
Average True Range (ATR) is the volatility gauge that tells you how much a stock actually moves in a normal day - the single most useful number for sizing positions and placing stops when the tape gets choppy, like the 2026 chip selloff.
What Is Average True Range (ATR)?
Average True Range (ATR) is a technical indicator that measures market volatility by averaging how far a stock travels over a set number of periods, typically 14. Instead of just measuring the distance from the day's high to its low, ATR uses a smarter input called the True Range, which also accounts for overnight gaps. The result is a single dollar figure that answers one practical question: how much does this stock normally move in a day?
That number is the foundation of disciplined risk management. If NVIDIA has an ATR of $7, you know a 7-point swing is just a normal Tuesday, not a reason to panic. If a quiet consumer-staples name has an ATR of $0.80, then a 7-point move would be a once-in-a-decade earthquake. ATR turns "this stock feels wild" into a precise, comparable measurement you can plug into a trading plan.
Crucially, ATR is non-directional. It rises when volatility expands - whether price is crashing or melting up - and it falls when the market goes quiet. It will never tell you to buy or sell. It tells you how much breathing room a position needs, which is exactly why it pairs so well with directional tools. If you are still learning how those directional signals fit together, our guide on combining RSI, MACD, and moving averages is a good companion to this one.
Who Invented ATR? Wilder's 1978 Breakthrough
ATR was created by J. Welles Wilder Jr., a mechanical engineer turned trader, and introduced in his landmark 1978 book New Concepts in Technical Trading Systems. That single book also gave traders the Relative Strength Index (RSI), the Parabolic SAR, and the Directional Movement system (ADX) - a remarkable run of inventions that still anchor charting platforms nearly half a century later.
Wilder designed ATR with commodities in mind, where markets routinely gap or move "limit up" and "limit down" between sessions. A simple high-minus-low range badly understated volatility on those days because it ignored the gap from the previous close. Wilder's True Range was built specifically to capture that missing volatility, and the concept transferred cleanly to stocks, ETFs, crypto, and forex.
The fact that a pre-computer-era indicator remains a default on every modern platform speaks to how robust the idea is. Volatility regimes change, but the math behind measuring them does not.
How Is ATR Calculated?
ATR is a two-step calculation: first you compute the True Range for each period, then you take a smoothed average of those True Ranges. Most platforms do this automatically, but understanding the mechanics helps you trust the number.
Step 1: True Range (TR)
For each bar, True Range is the largest of three distances:
- Current high minus current low (the standard daily range)
- The absolute value of the current high minus the previous close (captures an upside gap)
- The absolute value of the current low minus the previous close (captures a downside gap)
Formally:
The second and third terms are what make True Range "true." If a chip stock closes at 200 and gaps down to open at 188 after a bad guidance headline, the intraday high-low might only be 5 points, but the gap from the prior close makes the real move much larger. True Range catches that; a naive range does not.
Step 2: Average and smooth it
The first ATR value is simply the average of the first 14 True Ranges. After that, Wilder uses his own smoothing (a modified moving average) so each new bar updates the figure without throwing away history:
Here n is the lookback (14 by default). A shorter setting like 7 reacts faster and is twitchier; a longer setting like 21 or 30 is smoother and slower. Day traders often drop to 5-10 periods, while swing and position traders stick near 14-20.
A worked five-day example
The table below shows an illustrative calculation for a $200 stock. Numbers are simplified for clarity, not actual quotes.
| Day | High | Low | Prev Close | True Range |
|---|---|---|---|---|
| 1 | 202.0 | 198.5 | 200.0 | 3.5 |
| 2 | 201.0 | 196.0 | 199.0 | 5.0 |
| 3 (gap down) | 193.0 | 189.0 | 197.5 | 8.5 |
| 4 | 192.0 | 187.0 | 190.0 | 5.0 |
| 5 | 195.5 | 191.0 | 189.5 | 6.0 |
On Day 3, the high-low range was only 4 points, but the gap from the prior 197.5 close down to the 189 low produced a True Range of 8.5. Average those five True Ranges and you get an ATR of about 5.6 - meaning this stock typically swings roughly 5 to 6 dollars a day in this window.
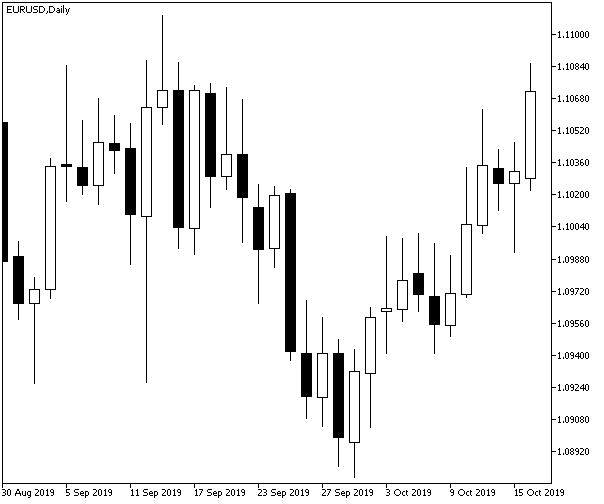
How to Read ATR on a Chart
ATR plots as a single line in a sub-panel below price, usually oscillating in a band that reflects the stock's recent character. Three reading habits cover almost everything you need:
- Absolute level: the current ATR value is the dollar size of a "normal" move. Use it directly for stops and targets.
- Direction of the line: a rising ATR means volatility is expanding (often around earnings, news, or a breakout); a falling ATR means the market is calming and ranges are compressing.
- Relative to its own history: an ATR near multi-month highs warns that risk is elevated, while an ATR near multi-month lows often precedes a volatility expansion - quiet markets rarely stay quiet.
One reading habit traders often get wrong: a spiking ATR by itself is not a sell signal. Because ATR is non-directional, a sharp jump can accompany a powerful rally just as easily as a crash. Always read it alongside price structure and trend tools. For the bigger-picture mood of the market - whether fear or greed is driving that volatility - pair ATR with the sentiment gauge on the Finance Halo market intelligence dashboard.
ATR vs Other Volatility Measures
ATR is one of several ways to quantify volatility, and each answers a slightly different question. Knowing where ATR fits keeps you from misusing it.
| Measure | What it captures | Best used for |
|---|---|---|
| ATR | Average dollar size of recent price moves, including gaps | Stop placement, position sizing, target setting |
| Standard deviation | Dispersion of closing prices around their mean | Statistical models, the Sharpe ratio, Bollinger Bands |
| Bollinger Bands | Price envelope set two standard deviations from a moving average | Spotting overextended price and volatility squeezes |
| VIX | Market's expected 30-day volatility implied by S&P 500 options | Gauging broad market fear, not a single stock |
The key practical difference: ATR is in dollars and includes gaps, which is exactly what you want when deciding where to put a stop or how many shares to buy. Standard deviation is in statistical units and only looks at closes, which makes it ideal for risk-adjusted return math like the Sharpe ratio but clumsy for placing an order. The VIX, often called the market's "fear gauge," measures the whole index, not your individual position. Use ATR for trade mechanics and the others for context.
How Do You Use ATR for Stop-Losses?
This is ATR's most valuable job. A fixed-percentage stop (say, "always exit 5% below entry") ignores how volatile a stock actually is, so it gets shaken out of choppy names and gives sloppy names too much rope. An ATR stop scales the exit to real volatility.
The recipe is simple: place your stop a multiple of ATR away from your entry or from a recent swing point. Common multipliers are 1.5x to 3x ATR:
- Long trade: stop = entry price minus (multiplier x ATR)
- Short trade: stop = entry price plus (multiplier x ATR)
If you buy a stock at 200 with an ATR of 6 and use a 2x multiplier, your stop sits at 188 - twelve points away, because that is what "normal noise" looks like for this stock. A tighter 6-point stop would likely be hit by routine intraday wiggle, ejecting you before your thesis even has a chance.
The Chandelier Exit
A popular trailing version is the Chandelier Exit, developed by Chuck LeBeau. For a long position, it trails the stop a set ATR multiple (classically 3x) below the highest high since you entered:
As price rises, the highest high rises, dragging the stop up behind it and locking in gains - while still giving the trade enough room to breathe through normal volatility. The stop only ever ratchets up, never down, on a long.
ATR Position Sizing: Constant Dollar Risk
The flip side of stop placement is deciding how many shares to buy. ATR lets you risk the same dollar amount on every trade regardless of how volatile the stock is - the cornerstone of professional risk control. The formula:
Say your account is $50,000 and you cap risk at 1% per trade, so $500 of risk. If a stock has an ATR of $6 and you use a 2x stop (a 12-point stop), you buy 500 / 12 = about 41 shares. If a calmer stock has an ATR of $2 with the same 2x stop (a 4-point stop), you buy 500 / 4 = 125 shares. Different share counts, identical dollar risk.
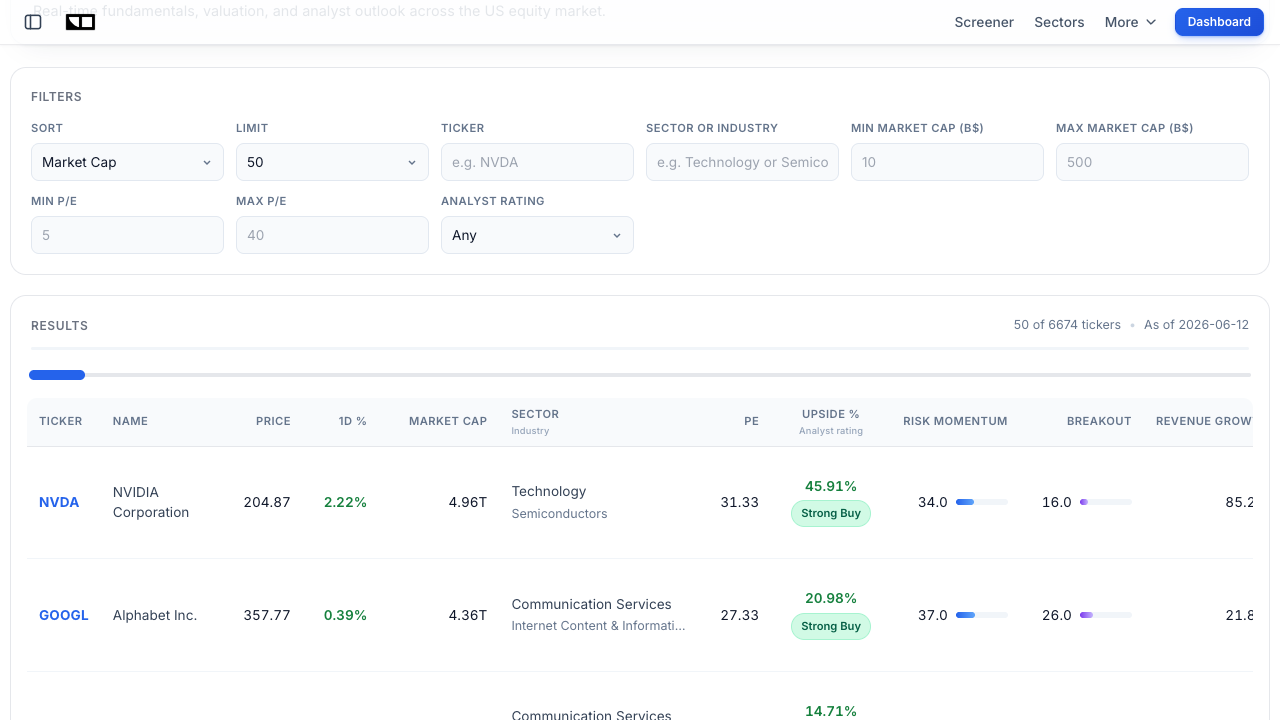
This is why ATR is the great equalizer. It automatically forces you to take smaller positions in wild names and larger positions in steady ones, so a single bad trade never blows a disproportionate hole in your account. You can sanity-check a candidate's volatility and fundamentals side by side using the Finance Halo market screener before you ever calculate a share count.
ATR for Profit Targets and Breakouts
ATR is not only for defense. Two offensive uses round out the toolkit.
Setting realistic profit targets
If a stock's ATR is $6, expecting a clean $30 move in two days is fighting the math - that is five average days of range packed into two. Multiplying ATR by a sensible factor gives a grounded target. A swing trader might aim for 2x to 3x ATR of profit while risking 1x to 1.5x ATR on the stop, building a favorable reward-to-risk ratio anchored in the stock's actual behavior rather than wishful thinking.
Confirming breakouts and filtering false moves
Volatility tends to expand when a real breakout fires. A common filter is to require a breakout candle to close more than a set fraction of ATR beyond the level - for instance, price must clear resistance by at least 0.5x ATR to count as a genuine break rather than a fakeout. Conversely, a breakout that happens while ATR is making new lows (a volatility squeeze) can signal a coiled spring about to release. This pairs naturally with the entry-timing ideas in our RSI, MACD, and moving averages walkthrough.
Real-World Example: ATR in the 2026 Chip Selloff
June 2026 was a brutal stress test for volatility-blind traders. On June 5, a violent slide in semiconductors dragged the Nasdaq Composite down about 4% for its worst session since the early-2025 tariff turmoil, and the chip complex shed roughly $1 trillion in market value in a matter of days. Soft guidance from Broadcom (AVGO) later erased a further chunk of the group, and questions about whether the buildout had peaked dominated headlines - a theme we unpacked in Is the AI Trade Cracking?
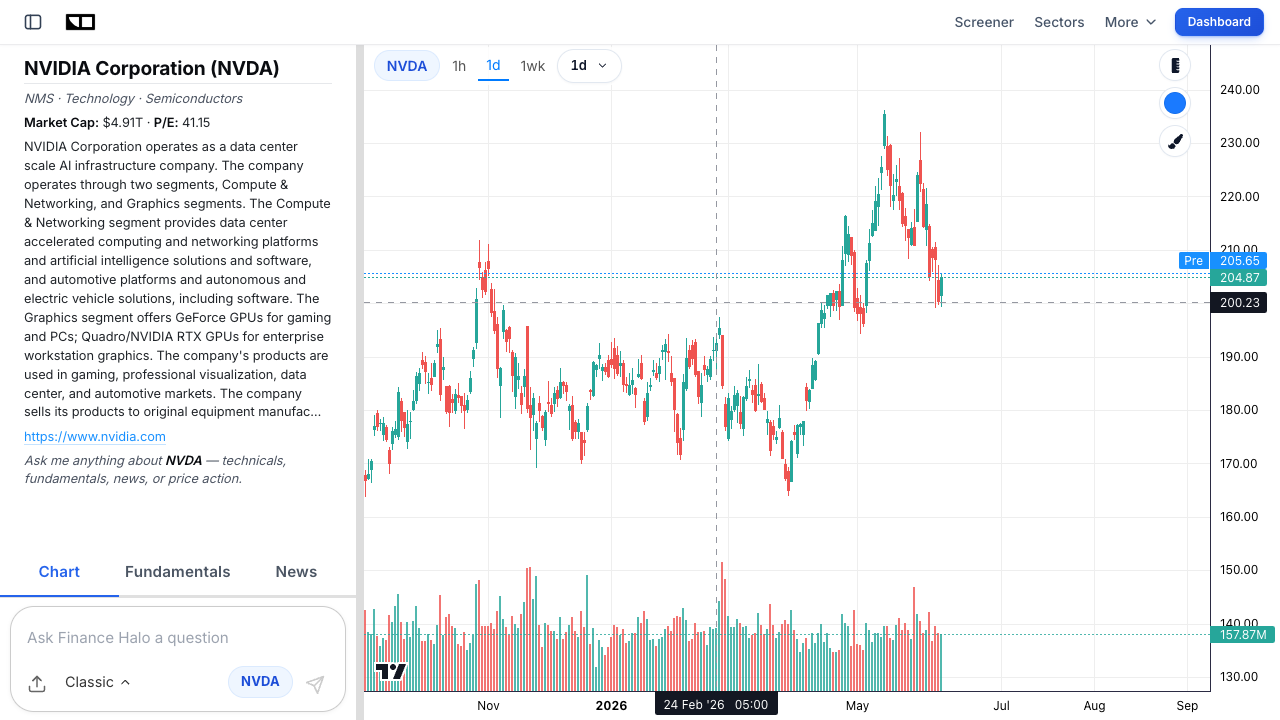
For a trader holding NVIDIA (NVDA) near $205, ATR was the difference between a planned exit and a panic. Consider an illustrative before-and-after:
| Metric | Calm tape (May) | Selloff (early June) |
|---|---|---|
| Approx. price | ~$230 | ~$205 |
| Illustrative ATR(14) | ~$5 | ~$11 |
| 2x ATR stop distance | ~$10 | ~$22 |
| Shares for $500 risk | ~50 | ~23 |
The lesson is stark. A trader using a fixed $10 stop in May would have been stopped out almost instantly in June, because normal daily noise had more than doubled. The ATR-aware trader did two things automatically: widened the stop to match the new volatility regime, and cut share size by more than half to keep dollar risk flat. Same risk budget, very different position - that adaptability is the entire point. The same discipline applies to AMD and Micron (MU), which saw even larger percentage swings during the rout. When volatility spikes like this, it also pays to know whether you are looking at a routine pullback or something worse - see Correction vs Bear Market.
What Is ATR Percent (ATRP)?
Raw ATR has one limitation: it is a dollar figure, so you cannot compare it across stocks at very different prices. An ATR of $6 is enormous for a $30 ETF but tiny for a $900 mega-cap. ATR Percent (ATRP) fixes this by dividing ATR by the closing price and expressing it as a percentage:
Now everything is on the same scale. A $205 stock with a $7 ATR has an ATRP of about 3.4%, while a $40 stock with a $2 ATR has an ATRP of 5% - so despite the smaller dollar figure, the cheaper stock is actually the more volatile one in percentage terms. ATRP is the right tool when you screen a watchlist for the most or least volatile names, or when you compare a stock's current volatility to its own multi-year history. It also lines up neatly with risk-adjusted scoring; Finance Halo's stock scores screener includes a Risk-Adjusted Momentum factor that rewards trend strength relative to volatility.
Common Mistakes to Avoid
- Treating ATR as a buy or sell signal: ATR is directionless. A high ATR does not mean "sell" and a low ATR does not mean "buy." Always combine it with trend and price-structure tools.
- Using one fixed stop across all stocks: a $5 stop that works on a calm name will be hit constantly on a volatile one. Scale the stop to ATR instead.
- Ignoring the timeframe: ATR on a 5-minute chart and ATR on a daily chart are completely different numbers. Match the ATR timeframe to your holding period.
- Comparing raw ATR across different-priced stocks: use ATRP for apples-to-apples comparisons; a bigger dollar ATR does not mean a more volatile stock.
- Forgetting that ATR is backward-looking: it averages past ranges and lags sudden regime shifts. Around scheduled events like earnings, expect realized volatility to jump ahead of the ATR line.
- Setting the multiplier without testing: a 2x multiplier is a starting point, not gospel. Different strategies and timeframes call for tighter or wider settings, so backtest before committing real capital.
Frequently Asked Questions
What is a good ATR value for a stock?
There is no universally "good" ATR, because it depends entirely on the stock's price and your strategy. What matters is the relationship between ATR and price (ATRP) and how the current reading compares to the stock's own history. A day trader wants enough ATR to produce tradeable moves, while a conservative investor may prefer lower-ATR names for a smoother ride.
What does an ATR of 14 mean?
People often confuse two things. "ATR 14" usually refers to the 14-period setting - the lookback window - not a value of 14. An actual ATR reading of 14 would mean the stock moves about $14 per period on average, which would be very large for most individual stocks.
Is a higher ATR better or worse?
Neither - it is just information. A higher ATR means more volatility, which offers bigger potential moves but demands wider stops and smaller position sizes to control risk. Aggressive traders may seek high-ATR stocks for opportunity; risk-averse investors often prefer lower-ATR names for stability.
What is the best ATR period setting?
The 14-period default from Wilder works well for daily swing trading. Day traders frequently shorten it to 5-10 periods for faster response, while longer-term position traders may extend it to 20-30 for a smoother signal. Test settings on your specific market and timeframe rather than assuming one number fits all.
Can ATR be used for crypto and forex?
Yes. ATR is asset-agnostic and works on stocks, ETFs, crypto, and currency pairs. It is especially useful in crypto, where 24/7 trading and large gaps make volatility-scaled stops essential. You can pull up an ATR-friendly chart for any asset, from NVDA to a crypto pair, on Finance Halo.
Does ATR predict direction?
No. ATR only measures the size of moves, never their direction. It will rise during both sharp rallies and sharp declines. To gauge direction, pair ATR with trend indicators, moving averages, or momentum tools like RSI and MACD.
How is ATR different from standard deviation?
ATR averages the True Range in dollars and includes overnight gaps, which makes it ideal for placing real orders. Standard deviation measures the statistical dispersion of closing prices and ignores gaps, which makes it better for risk models and metrics like the Sharpe ratio but awkward for setting a stop.
Conclusion
Average True Range is deceptively simple for how much it improves a trading plan. It does one thing - measure how much a stock typically moves, gaps included - and it does it well enough to anchor your three most important risk decisions: where to place stops, how many shares to buy, and what targets are realistic. The 2026 chip selloff was a live reminder of why that matters. When volatility on names like NVDA doubled in days, traders who scaled stops and position sizes to ATR stayed in control, while those using fixed-dollar rules were either shaken out or over-exposed. Master the True Range formula, respect that ATR is non-directional, lean on ATRP to compare across stocks, and you turn a quiet indicator into the backbone of disciplined risk management.
Try it yourself: Analyze NVDA with Finance Halo's AI assistant to see its current volatility, technical setup, and price action in seconds - then size your next trade with confidence.
Disclaimer: This article is for educational purposes only and does not constitute investment advice. Always do your own research before making investment decisions.