Free Stock Chart Widget for Your Website (Copy-Paste)
6/12/2026
Need a free stock chart widget for your website? Here is a live, auto-updating price chart you can embed on any site, blog, or newsletter landing page with one copy-paste snippet. It works for any stock, ETF, crypto, or forex pair, ships with light and dark themes, and requires no account, no API key, and no JavaScript.
What Is a Stock Chart Widget?
A stock chart widget is a small, self-contained piece of HTML, usually an iframe, that renders a live price chart inside your own webpage. The data and the rendering are handled by the widget provider's servers, so your site does not need a market data subscription, a charting library, or any backend code.
Widgets solve a real problem for anyone who writes about markets. A static chart screenshot is frozen at the moment you took it: the price is stale within hours, and an article from last quarter shows a market that no longer exists. A live widget keeps every post current forever, with zero maintenance.
The Finance Halo chart widget specifically shows three things in a compact card:
- The live price and percent change for the ticker you choose.
- A daily-close line chart covering the last 7, 14, or 30 trading sessions.
- An attribution footer linking to the full interactive chart, which is the one condition of free use.
See the Live Widget in Action
This is not a screenshot. The chart below is the actual embedded widget, served live and showing the S&P 500 ETF right now:
Whatever day you are reading this, the price and the chart above are current. That is the entire pitch for live widgets over images.
How Do You Embed a Free Stock Chart on Your Website?
Three steps, about 30 seconds:
- Open the Finance Halo widgets gallery.
- In the Mini Ticker Chart card, type your ticker, pick the time range and theme, and click Copy code.
- Paste the snippet into your page where the chart should appear.
The snippet looks like this:
<!-- NVDA mini chart - Finance Halo -->
<iframe src="https://financehalo.com/embed/chart/NVDA?days=30"
width="420" height="230"
style="border:0;overflow:hidden;border-radius:12px"
loading="lazy"
title="NVDA price chart - Finance Halo"></iframe>
<p style="font-size:12px">
<a href="https://financehalo.com/chart/NVDA">NVDA live chart & AI analysis</a>
by <a href="https://financehalo.com">Finance Halo</a>
</p>The iframe renders the chart; the small attribution line below it credits the data source and is the only requirement for free commercial use. The loading="lazy" attribute means the widget does not load until the reader scrolls near it, so it adds essentially nothing to your page load time, a pattern recommended in web.dev's guidance on lazy-loading iframes.
Customization: Ticker, Time Range, and Dark Mode
Everything is controlled through the URL, so you can hand-edit the snippet without going back to the generator:
| Parameter | Values | Example |
|---|---|---|
| Ticker (path) | Any supported symbol, uppercase | /embed/chart/AAPL |
days | 7, 14, or 30 trading sessions | ?days=14 |
theme | dark (default is light) | ?days=30&theme=dark |
width / height (iframe) | Any size; the chart stretches to fill | width="100%" height="300" |
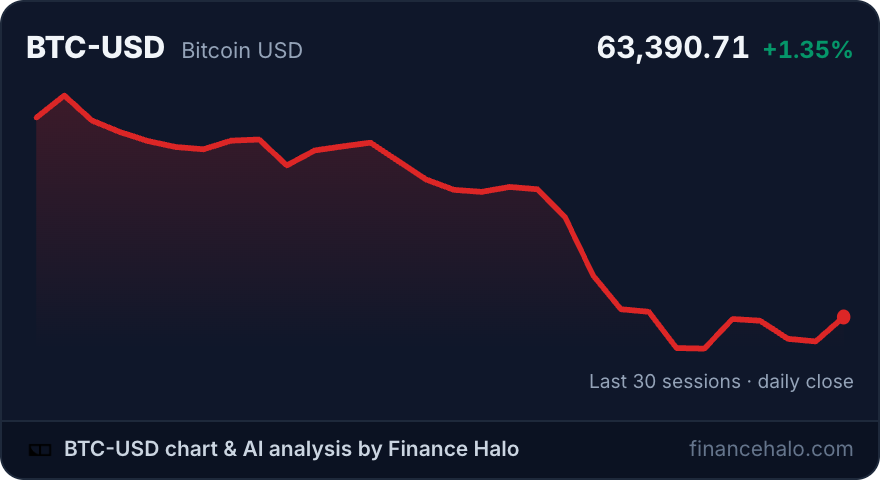
The dark theme is a single parameter, which makes the widget at the top of this article: a dark card with the live Bitcoin price. Set width="100%" and the chart becomes fully responsive, expanding to the column it sits in. Give it a taller iframe and the chart area grows to fill the space, so it works as a compact sidebar element or a full-width section divider.
Stocks, ETFs, Crypto, and Forex: What Tickers Work?
The widget accepts the same Yahoo-style symbols as the rest of Finance Halo, which covers essentially every major asset class:
| Asset class | Symbol format | Examples |
|---|---|---|
| US stocks | Plain ticker | NVDA, AAPL, TSLA |
| ETFs and index funds | Plain ticker | SPY, QQQ, VTI |
| Crypto | Pair with -USD suffix | BTC-USD, ETH-USD |
| Forex | Pair with =X suffix | EURUSD=X, GBPUSD=X |
A few practical pairings: a post comparing index funds, like our guide to MSCI World versus the S&P 500, benefits from a live SPY chart. A stock write-up on NVIDIA can show the live NVDA price next to the thesis. A crypto commentary stays honest because readers see the current BTC-USD level, not the one from publication day.
Adding the Chart to WordPress, Ghost, Notion, and More
WordPress
Add a Custom HTML block in the Gutenberg editor, paste the snippet, preview, publish. In the classic editor, paste into the Text (HTML) tab. No plugin needed, and page builders like Elementor accept the same snippet in their HTML element.
Ghost
Type /html to insert an HTML card and paste the snippet. The chart renders on the web version of your post; email clients strip iframes, so newsletter issues should link to the post instead.
Notion
Skip the snippet entirely: type /embed and paste the widget URL directly, for example https://financehalo.com/embed/chart/NVDA?days=30. Notion renders the live chart inline, including on public Notion pages.
Squarespace, Wix, Webflow, Carrd, and static HTML
All of them accept raw HTML blocks (Code block, Embed HTML, Embed element, Embed widget respectively). If the platform lets you paste HTML, the widget works as-is.
Is It a Good TradingView Widget Alternative?
TradingView's widget library is the best-known option and it is genuinely good, especially if you need candlesticks, indicators, or an interactive mini terminal on your page. The free tier comes with TradingView branding and links, and per their widget FAQ, removing that branding requires contacting them about paid options.
The honest comparison depends on what you need:
| Finance Halo chart widget | TradingView free widgets | Static chart image | |
|---|---|---|---|
| Live data | Yes, 5-minute refresh | Yes | No, frozen at publish |
| Setup | One iframe, no script | Script or iframe embed | Manual screenshot each time |
| Page weight | A few KB, lazy-loaded | Heavier interactive library | Image weight only |
| Branding | One small attribution link | TradingView logo and links | None |
| Indicators and candles | No, clean line chart | Yes, extensive | Whatever you screenshot |
| Cost to remove branding | Not removable (it is the license) | Paid, on request | Free |
Pick TradingView when your readers need to interact with indicators on your page, for example alongside a tutorial like our guide to combining RSI, MACD, and moving averages. Pick the Finance Halo widget when you want the lightest possible live price chart that simply keeps your content current, with a footprint closer to an image than an app.
What Readers Get When They Click the Chart
The attribution link under each widget points to the full chart page for that ticker, which is a complete research view: an interactive candlestick chart, fundamentals, news, and an AI assistant that answers questions about the stock in plain language.
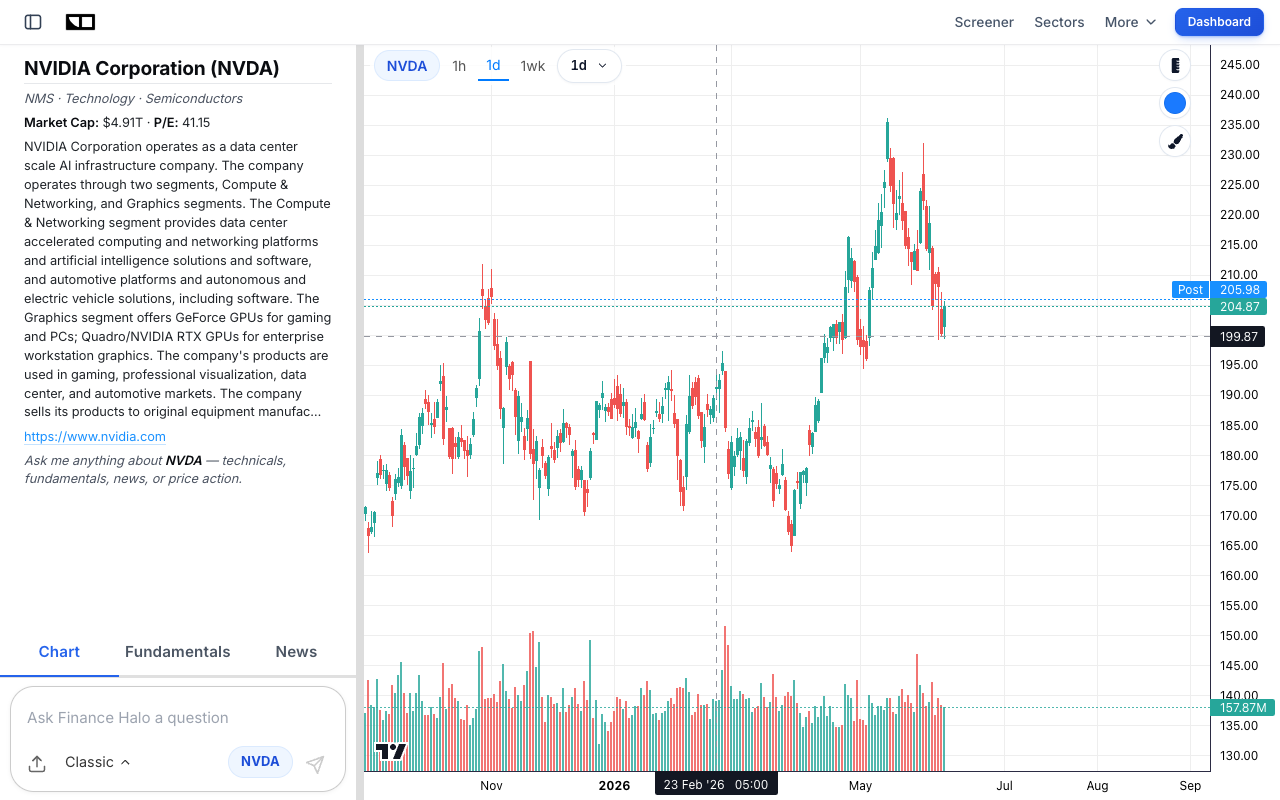
That matters for your site too: embedding a widget is not a dead end for your readers, it hands them a genuinely useful tool. If you write stock analysis, the same flow works for research: screen for candidates with the free market screener, study the setup on the chart page, then embed the widget in the article, a workflow that pairs well with our beginner's guide to analyzing a stock before buying.
Common Mistakes to Avoid
- Removing the attribution link. It is the entire license. Keep it and the widget is free for commercial use indefinitely.
- Pasting into a rich-text field. Visual editors escape HTML and show your readers the code. Always use the platform's HTML or embed block.
- Lowercase or malformed tickers. Use uppercase symbols and the right suffix:
BTC-USDfor crypto,EURUSD=Xfor forex. A wrong symbol shows a clean "no data" card rather than breaking your page, but it helps no one. - Expecting intraday candles. The widget plots daily closes for clarity at small sizes. For intraday and indicators, link readers to the full chart page instead.
- Embedding ten charts on one page. Each iframe is light, but a wall of widgets dilutes your content. One or two per article is the sweet spot.
- Forgetting the email rule. No email client renders iframes. Put the widget on your site and link to it from your newsletter.
Frequently Asked Questions
Is the stock chart widget really free?
Yes. No account, no API key, no trial, no usage caps. The single condition is keeping the attribution link in the embed code visible and unmodified. Commercial sites, monetized blogs, and paid newsletters are all fine.
How often does the chart update?
Embedded charts are served with a 5-minute cache, so the price and chart refresh within minutes during the trading day without you touching anything.
Will the widget slow down my website?
No. The embed is a few kilobytes of server-rendered HTML and SVG with no charting library, and the snippet ships with loading="lazy" so it does not load until the reader scrolls to it.
Can I show crypto or forex instead of stocks?
Yes. Use Yahoo-style symbols: BTC-USD or ETH-USD for crypto and EURUSD=X for forex pairs. ETFs like SPY and QQQ work exactly like stocks.
Does it work on WordPress.com or only self-hosted WordPress?
Self-hosted WordPress and any plan that allows the Custom HTML block work out of the box. WordPress.com restricts iframes on lower tiers, so check whether your plan allows custom embeds.
Is there a dark mode?
Yes, add theme=dark to the widget URL or flip the theme selector in the gallery's code generator. The dark card matches dark sites without any custom CSS.
Can I resize the widget?
Yes, set any iframe width and height. The header stays pinned, the chart stretches to fill the available space, and width="100%" makes it responsive to the column it sits in. Keep the height at 200 or more so the header and chart both breathe.
Conclusion
A free stock chart widget is the cheapest upgrade a finance website can make: one copy-paste snippet turns static articles into pages that always show the live market. The Finance Halo widget keeps it deliberately simple, a clean daily-close chart with the live price for any stock, ETF, crypto, or forex pair, light or dark, lazy-loaded, and free for commercial use with a single attribution link. If you need a full interactive terminal, TradingView remains the reference; if you want the lightest live chart that just works, copy the snippet and you are done. And if market sentiment is more your angle than single tickers, the same gallery offers the free Fear & Greed Index widget with the identical copy-paste flow.
Try it yourself: Grab the free stock chart widget for your site, and use Finance Halo's AI assistant to get instant analysis on any stock. Just type a ticker and ask your question.
Disclaimer: This article is for educational purposes only and does not constitute investment advice. Always do your own research before making investment decisions.